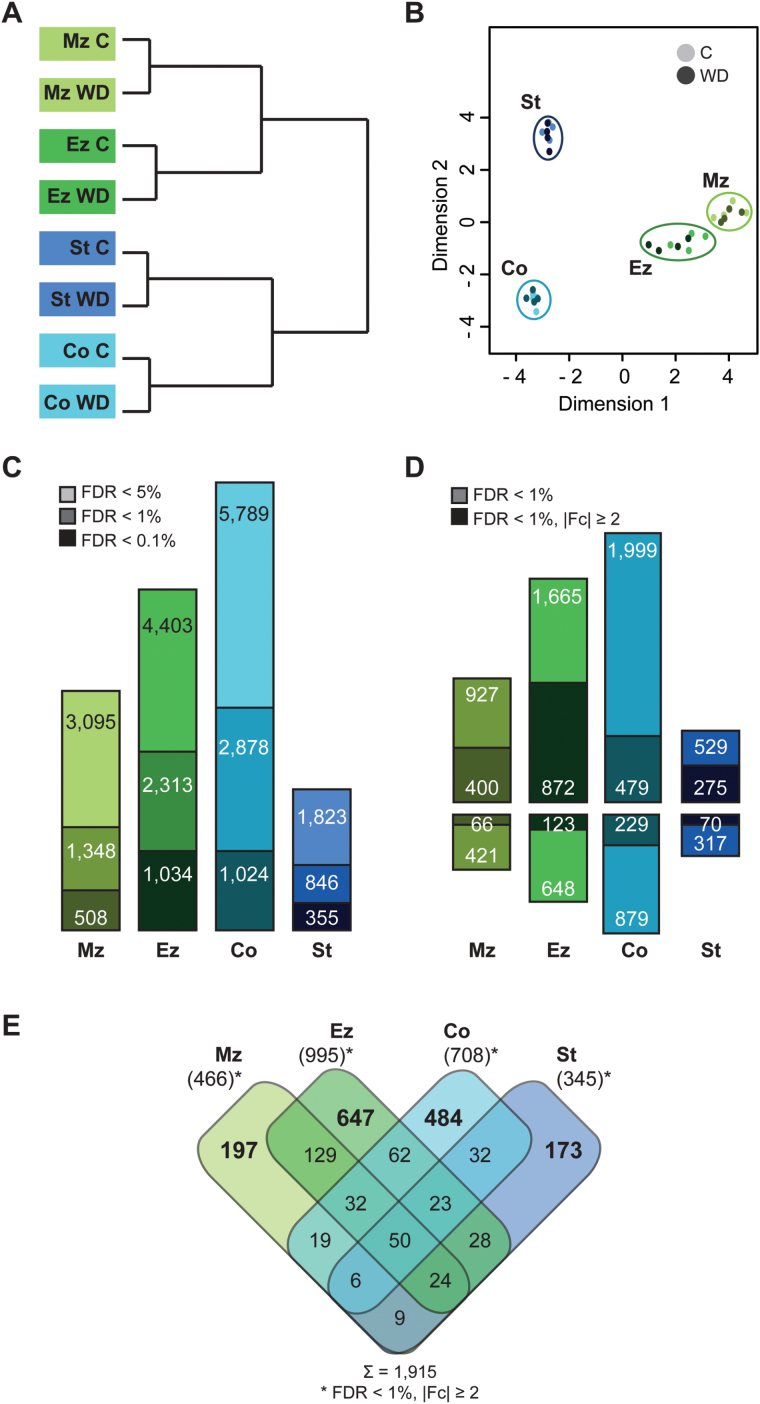
Fig. 2.
Sample relationship and differential gene expression. (A) Hierarchical clustering and (B) multidimensional scaling plot of root tissue transcriptomes. (C) Numbers of differentially expressed genes in the four root tissues at different significance levels (light colour, FDR <5%; medium dark colour, FDR <1%; dark colour, FDR <0.1%). (D) Numbers of up- and down-regulated genes (FDR <1%); dark bars represent strongly regulated genes (|log2Fc| ≥1). (E) Overlap between differentially expressed genes (FDR <1%; |log2Fc| ≥1) in the four root tissues. Mz, meristematic zone; Ez, elongation zone; Co, cortex; St, stele; C, control; WD, water deficit treatment.

