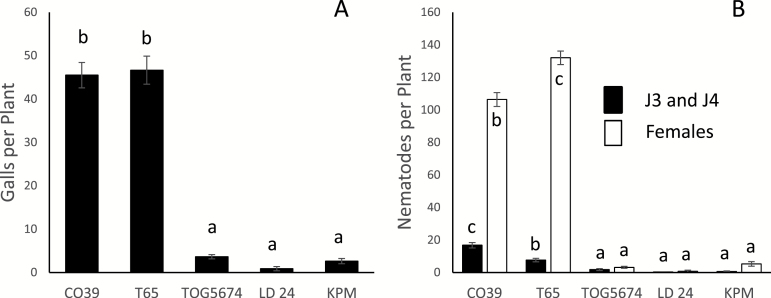
Fig. 6.
Responses of susceptible CO39 and T65, and resistant TOG5674, LD 24, and Khao Pahk Maw rice genotypes to M. graminicola 17 DAI with ±200 nematodes. Response of each genotype is evaluated in terms of (A) number of galls per plant, (B) number of nematodes (J3 and J4, and females) per plant. Each bar with standard error (±SE) represents the average number of galls or nematodes recorded on eight plants for each genotype. Letter(s) on error bars are based on statistical analysis (Duncan’s multiple range tests after one-way ANOVA). Genotypes having different letters are statistically significant (P = 0.05). The experiment was done twice with similar results.

