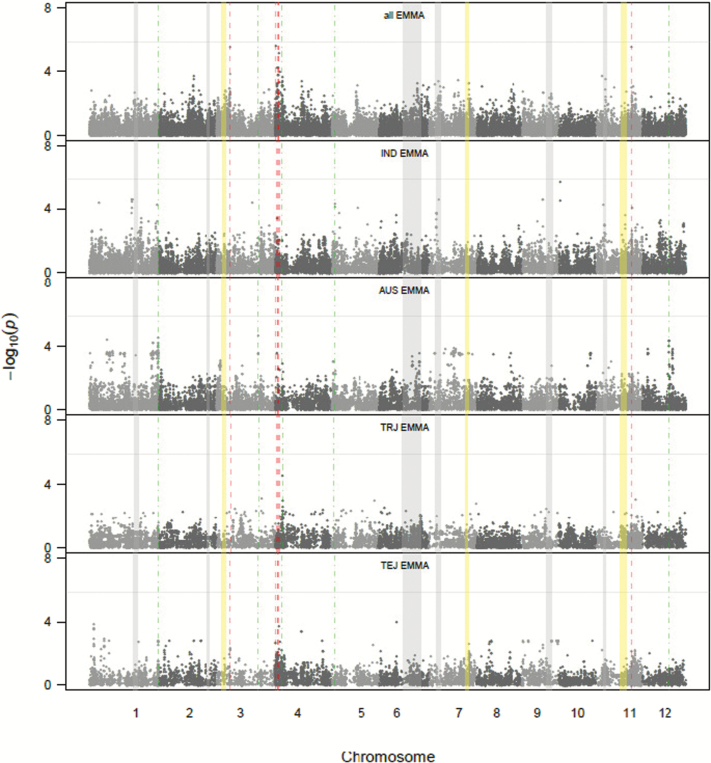
Fig. 7.
GWA of nematode gall numbers across and within subpopulations. P-values from the mixed model for all cultivars in top panel (all), and for tropical japonica (TRJ), temperate japonica (TEJ), indica (IND), and aus (AUS) subpopulations individually in subsequent panels. The aromatic subpopulation was not included owing to its small sample size. X-axis indicates the SNP location along the 12 chromosomes y-axis is the −log 10 (P value). Red dotted lines indicate where the associated SNPs in the ‘all’ analysis were detected while green were detected in one of the subpopulation analyses. Grey shading indicates QTLs detected in [33] while those in yellow are biallelic epistatic interactions also detected in the [33] study but not reported.

