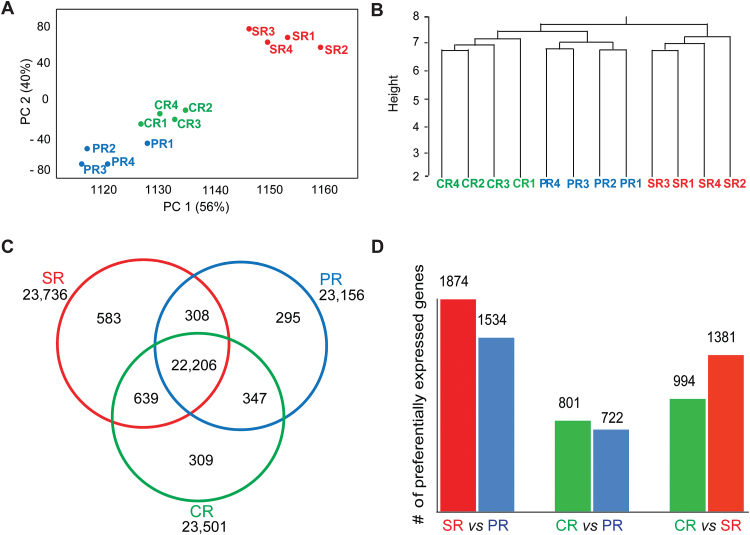
Fig. 2.
Relationship of root transcriptome samples, root type-specific gene expression, and differential gene expression. (A) Principal component analysis (PCA) of the 12 RNA-seq samples of the three root types. The first and second principal components collectively explain 96% of variance. (B) Hierarchical clustering of the 12 RNA-seq samples of the three root types based on Euclidian distance. The y-axis indicates the degree of the variance. (C) Number of genes with conserved and root type-specific expression in the three root types. (D) Pairwise comparisons of differentially expressed (FDR <5%, |log2Fc| ≥1) genes among the three root types. PR, primary roots; SR, seminal roots; CR, crown roots; PC 1 and PC2, principal component one and two.

