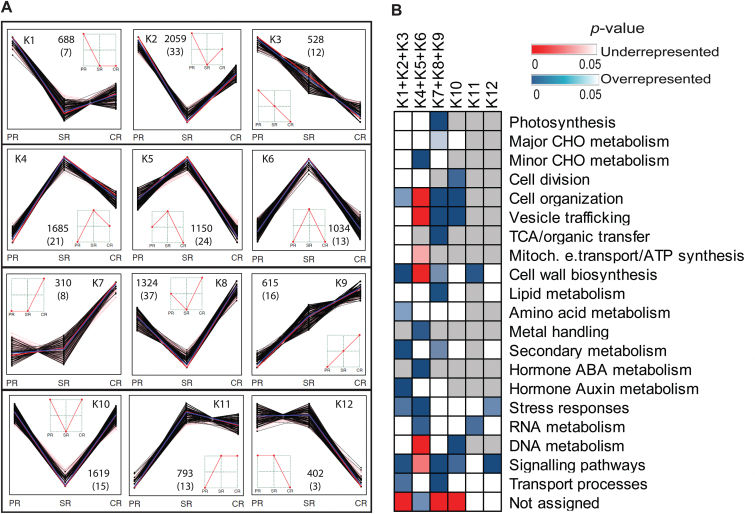
Fig. 3.
Global expression profiling of genes among the three root types. (A) K-means clustering showing all 12 possible expression patterns of 12 207 differentially expressed genes (202 classical maize genes in parentheses). Each black line represents a gene; the red lines represent median values; the blue lines represent the mean value. (B) Over- or under-representation of MapMan functional categories among six patterns representing peak expression in one or two root types. Clusters K1–K3 (primary roots), K4–K6 (seminal roots), and K7– K9 (crown roots) were combined in this analysis because they displayed peak expression in one of the three root types (χ2 tests, P<0.05; red, significantly under-represented; blue, significantly over-represented; white, not significant; gray, not detected). PR, primary roots; SR, seminal roots; CR, crown roots.

