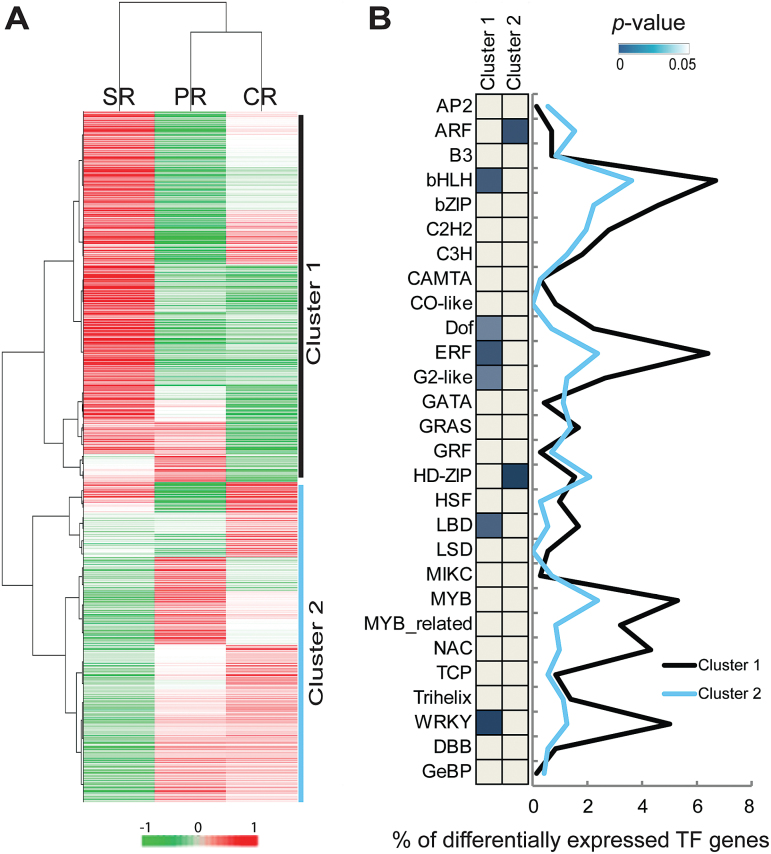
Fig. 4.
Dynamics of the expression profiles of transcriptional regulators. (A) Hierarchical clustering analysis of 1252 differentially expressed genes involved in transcriptional regulation of the three root types based on average expression values. (B) Classification of genes in 28 major transcription factor families of the two clusters from (A) as a proportion (in %) of all differentially expressed transcription factor genes. Significantly enriched families in each cluster were determined by Fisher’s exact tests (P<0.05) and indicated by blue blocks. Gray, not significant. PR, primary roots; SR, seminal roots; CR, crown roots.

