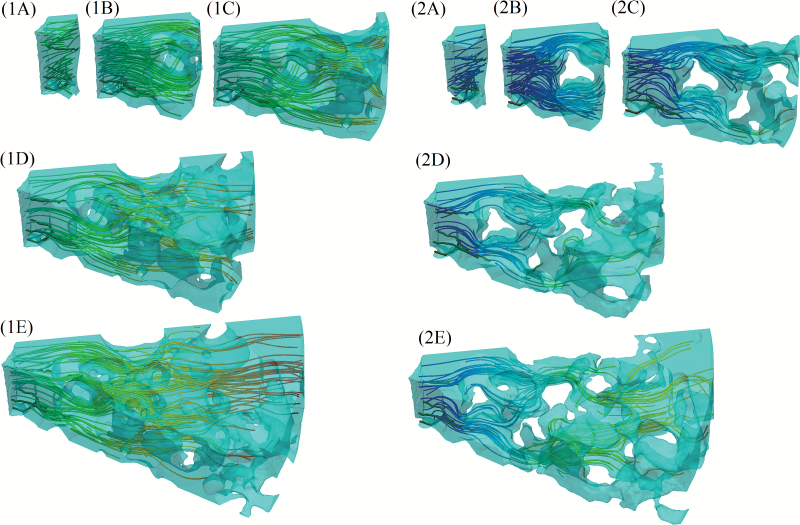
Fig. 5.
Typical plots obtained from simulation for the saturated case (1A–E). and the partially saturated case (2A–E). The five images in each case correspond to and for (A) (B) (C) (D) and (E) The streamlines show the effective diffusion paths, with red corresponding to high nutrient concentration and blue corresponding to lower nutrient concentration. (This figure is available in colour at JXB online.)

