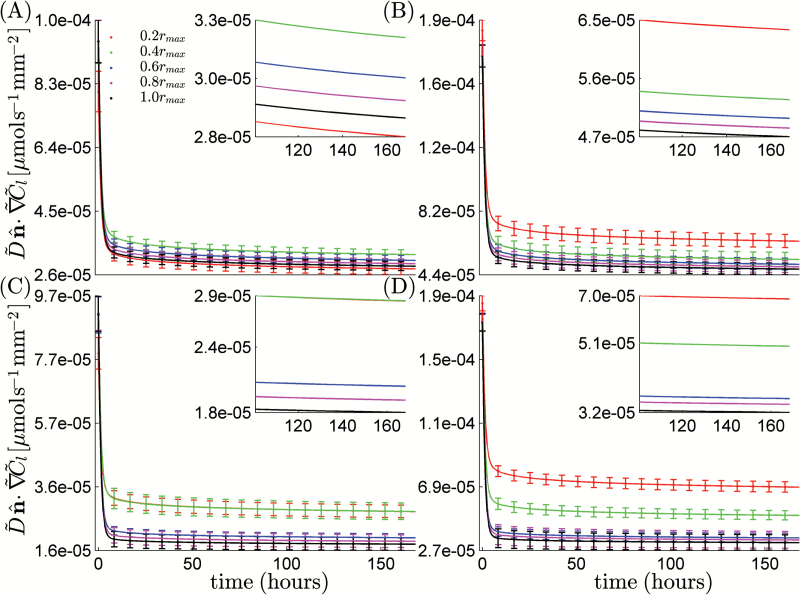
Fig. 6.
Log-linear plot of flux into the root hairs in the saturated case (A), the roots in the saturated case (B), the root hairs in the unsaturated case (C), and the roots in the unsaturated case (D). The lines show the average flux over a period of 1 week for the five different radii considered up to a maximum of r max=1.76mm. As r is increased, the uptake profile was seen to converge. The figure insets show a zoomed-in section of the same curve with error bars removed for clarity. (This figure is available in colour at JXB online.)

