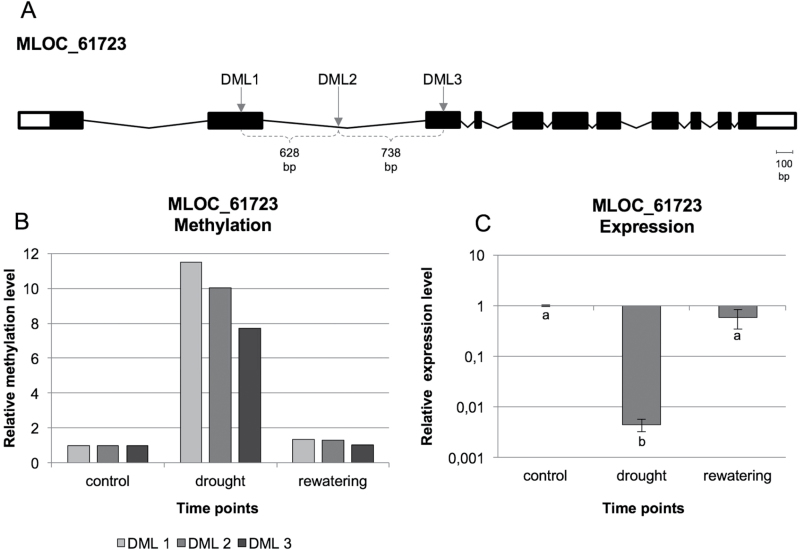
Fig. 5.
(A) Structure of the MLOC_61723 gene with the three DMSs that were identified indicated. (B) Relative methylation level of the three different DMSs in leaves, which were localized within the gene body of MLOC_61723 based on MSAP-Seq data. (C) Relative expression level of the MLOC_61723 gene in the leaves. Different letters indicate significant differences as determined by one-way ANOVA followed by Fisher’s LSD post-hoc test (P≤0.05). All values are presented as fold change (FC) in relation to the control (with FC=1).

