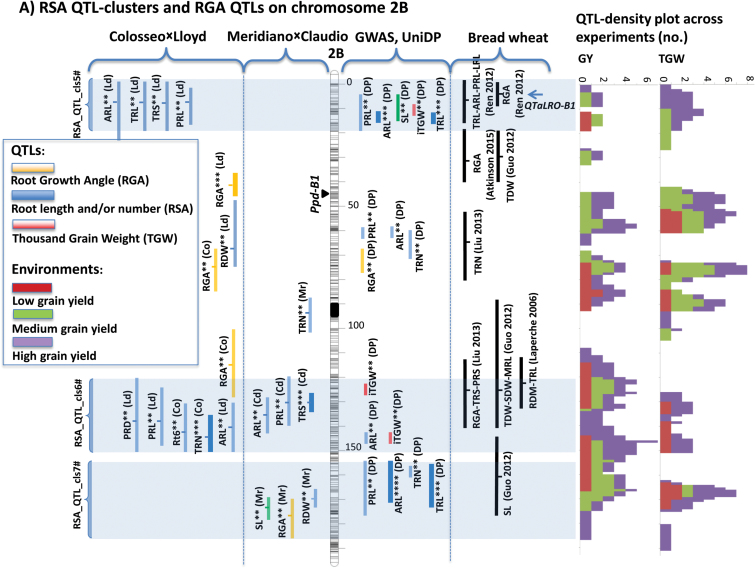
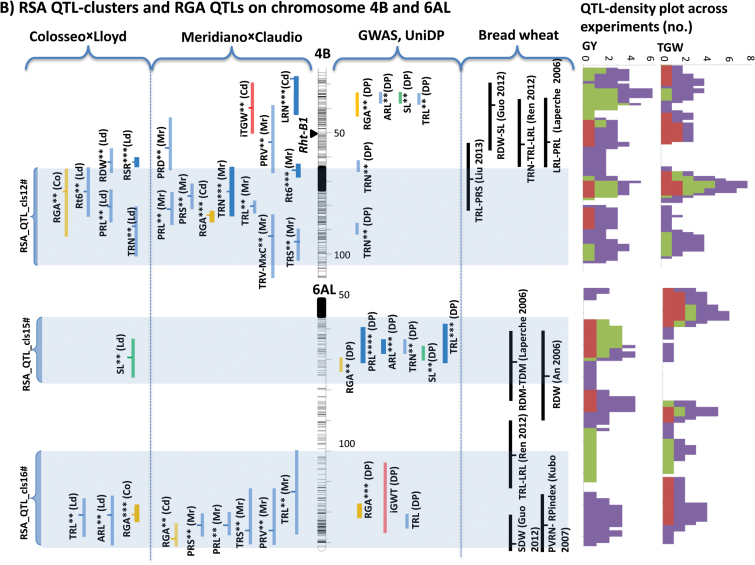
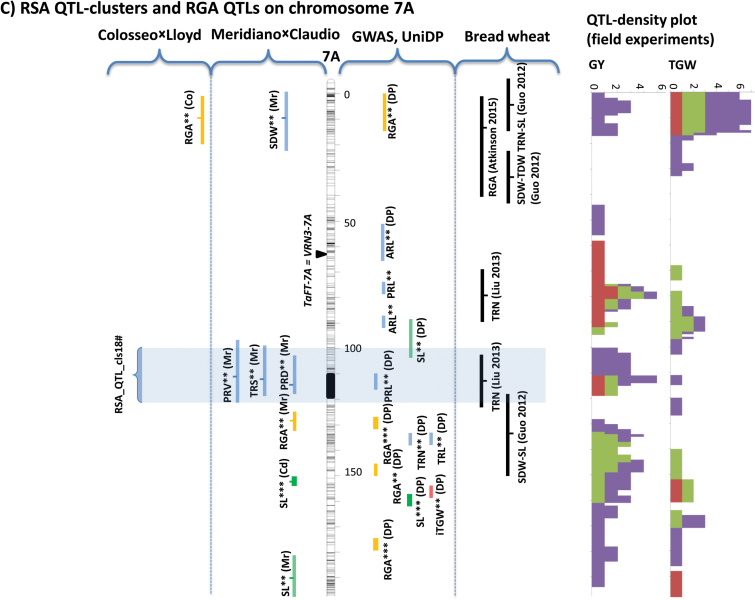
Fig. 4.
Genetic maps of root system architecture (RSA) QTL clusters and root growth angle (RGA) QTLs for chromosomes 2B, 4B, 6A, and 7A. The reference map is the tetraploid consensus map reported by Maccaferri et al. (2015). RSA and RGA QTLs from Co×Ld and Mr×Cl RIL populations, GWAS QTLs from Unibo-DP. and previously published QTLs from bread wheat studies have been projected onto the reference maps. Single-component QTLs are reported as vertical bars corresponding to confidence intervals. RSA QTL clusters are highlighted by horizontal shaded banding. GY and TGW QTLs in the trait acronyms are the same as in Table 1. QTL significance levels are highlighted using ** for suggestive QTLs, *** for nominal QTLs, and **** for GWAS experiment-wise significant QTLs (Unibo-DP only).


