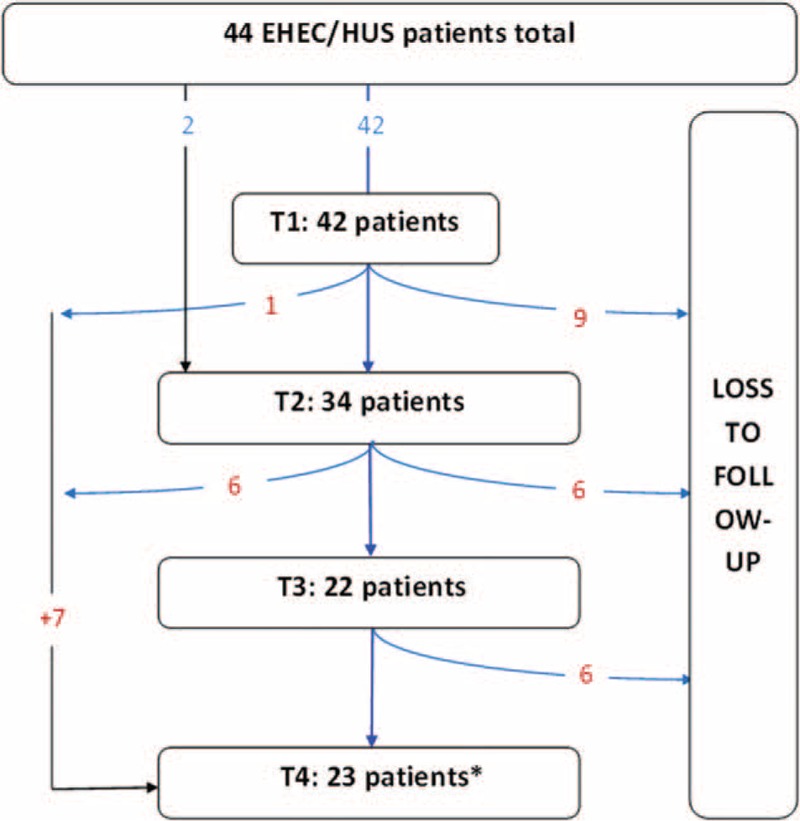
FIGURE 1.

Diagram of loss to follow-up-SO: symptom onset, T1 acute phase of infection, T2-4 follow-up visits; PRES: posterior reversible encephalopathy syndrome ∗ patients, who were lost to follow-up but participated the questionnaire at T4.SO�=� symptom onset.
