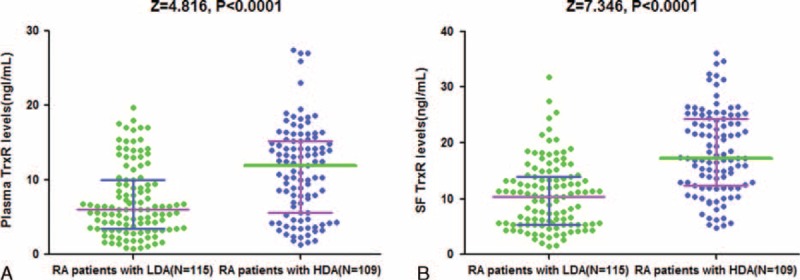
FIGURE 3.

Levels of TrxR in different groups. (A) Plasma levels of TrxR in RA patients with HAD and LDA; (B) SF levels of TrxR in RA patients with HAD and LDA. All data are medians and interquartile ranges (IQR). HAD = high-diseases activity, LDA = low-diseases activity, RA = rheumatoid arthritis, SF = Synovial fluid, TrxR = thioredoxin reductase.
