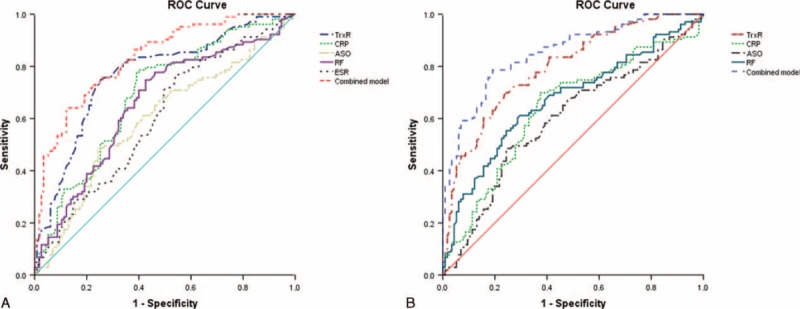
FIGURE 4.

(A) Receiver operator characteristic (ROC) curve demonstrating sensitivity as a function of 1-specificity for diagnosing HDA based on the combined model incorporating (TrxR/RF/CRP/ASO/ESR) and the relative contribution of each plasma biomarker alone (initial cohort). This combined model had an area under the ROC curve of (AUC, 0.833; 95% CI, 0.780–0.885). (B) ROC curve demonstrating sensitivity as a function of 1-specificity for diagnosing HDA based on the combined model incorporating (TrxR/RF/CRP/ASO) and the relative contribution of each SF biomarker alone (initial cohort). This combined model had an area under the ROC curve of (AUC, 0.851; 95% CI, 0.801–0.901). ASO = antistreptolysin-O, AUC = area under the curve, CI = confidence interval, CRP = C-reactive protein, ESR = erythrocyte sedimentation rate, HDA = high-diseases activity, RA = rheumatoid arthritis, RF = rheumatoid factor, SF = Synovial fluid, TrxR = thioredoxin reductase.
