
FIGURE 3.
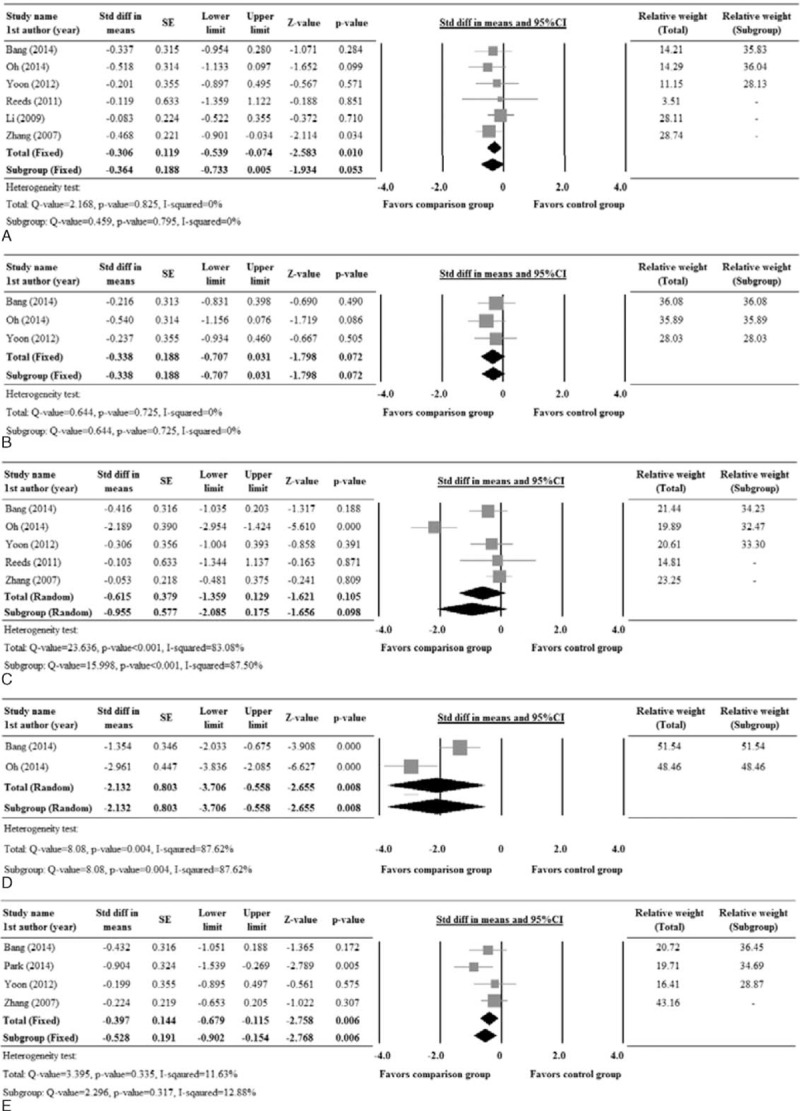
Forest plot showing the change in levels of (A) fasting glucose, (B) postprandial glucose, (C) fasting insulin, (D) postprandial insulin, and (E) HOMA-IR compared between patients who underwent comparison and control group treatments. 1st AU = first author, SE = standard error, Std diff = standardized difference, 5% CI, lower limit and upper limit.