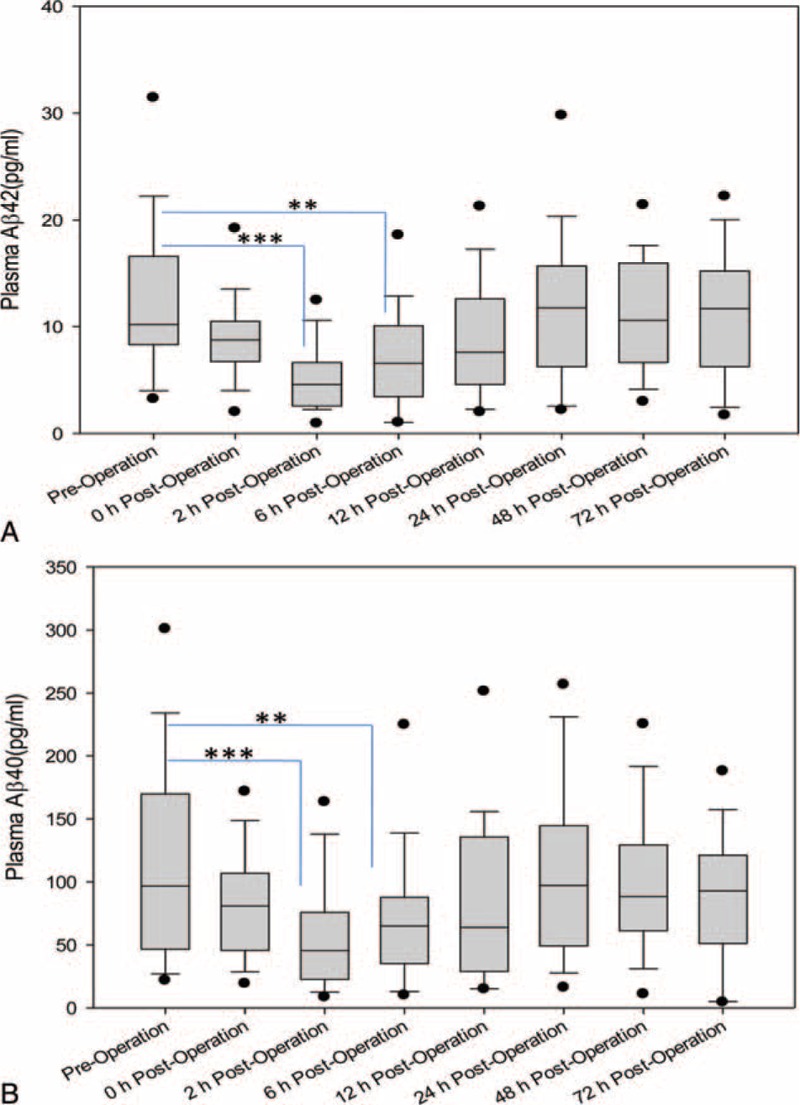
FIGURE 1.

(A) Box-and-whisker plot of plasma Aβ42 levels following cardiac surgery with CPB. Distribution of Aβ42 levels among 42 patients at preoperation, 0, 2, 6, 12, 24, 48, and 72 hours postoperation. Box plots demonstrate median with interquartile ranges; error bars indicate 10th to 90th percentile values; and black dots show maximum and minimum levels. (B) Box-and-whisker plot of plasma Aβ40 levels following cardiac surgery with CPB. Distribution of 40 levels among 42 patients at preoperation, 0, 2, 6, 12, 24, 48, and 72 hours postoperation. Box plots demonstrate median with interquartile ranges; error bars indicate 10th to 90th percentile values; and black dots show maximum and minimum levels.
