FIGURE 1.

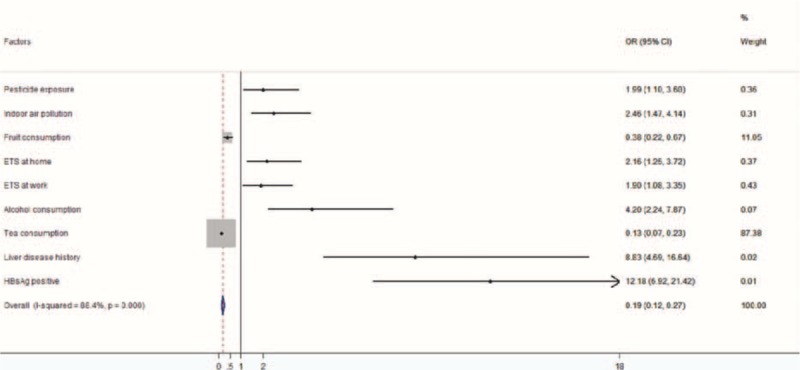
The forest plot of adjusted OR and 95% CI for the multivariate logistic regression. CI = confidence interval, OR = odds ratio.

The forest plot of adjusted OR and 95% CI for the multivariate logistic regression. CI = confidence interval, OR = odds ratio.