FIGURE 1.

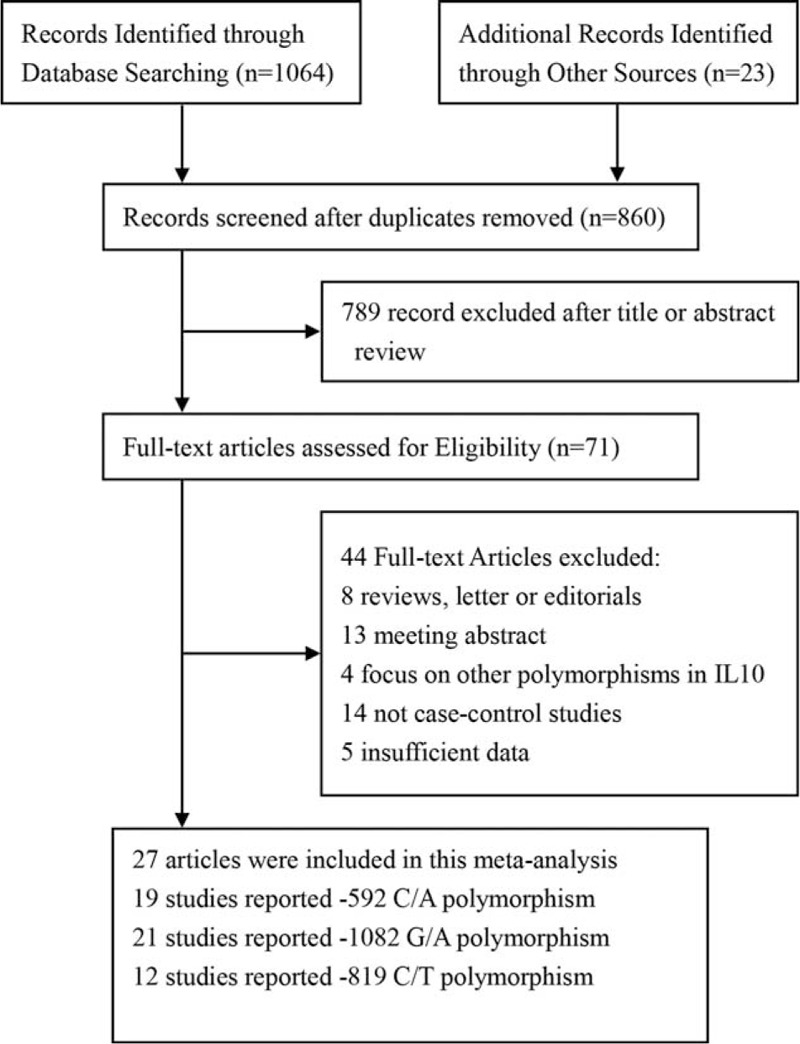
Flow chart of the search strategy and study selection. The terms “N” in the boxes represent the number of corresponding studies.

Flow chart of the search strategy and study selection. The terms “N” in the boxes represent the number of corresponding studies.