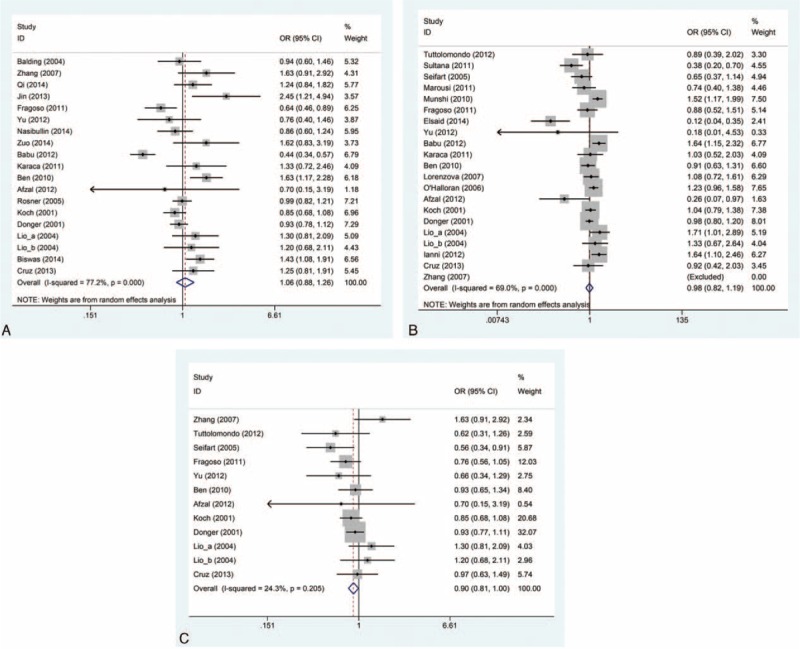
FIGURE 2.

Forest plot of the risk of CVD associated with the IL-10 gene polymorphisms under dominant genetic model. (A) IL-10 -592C/A polymorphism. (B) IL-10 -1082G/A polymorphism. (C) IL-10 -819C/T polymorphism. The solid diamonds and horizontal lines correspond to the study-specific ORs and 95% CIs. The gray areas reflect the study-specific weight. The hollow diamonds represent the pooled ORs and 95% CIs of the overall population. The vertical solid lines show the OR of 1 and the vertical dashed lines indicate the corresponding pooled OR. CI = confidence interval, CVD = cardiovascular disease, OR = odds ratio.
