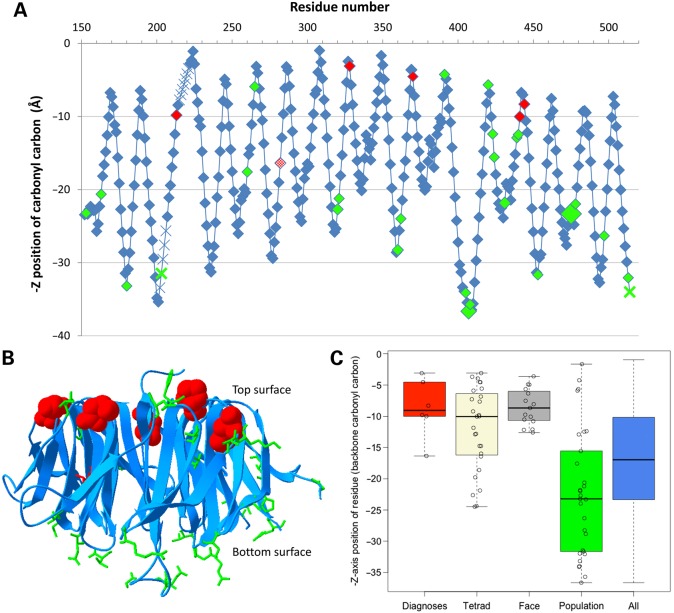
Figure 4.
Z-axis location of all variants in the WD40 domain of TBLR1. (A) Graphical representation taken from the top to bottom face (PDB entry 4lg9). Likely pathogenic missense mutations are indicated in red (with new diagnoses from the DDD study completely filled), whereas population missense variants are indicated in green and other residues are indicated in blue. The backbone position of all residues is shown, based on the Z-axis location of the backbone carbonyl carbon in the crystal structure. Larger diamonds represent variants that are present multiple times across the databases, and crosses indicate the approximate interpolated location of residues that are absent from the PDB file. (B) Three-dimensional representation viewed from the side using PDB entry 4lg9, with all missense variants highlighted using-stick representation (space-filled for new DDD diagnoses). Likely pathogenic missense mutations are indicated in red, whereas population missense variants are indicated in green and the rest of the domain is represented using blue ribbons. (C) Boxplot of Z-axis location in PDF entry 4lg9 of diagnostic mutations (red), the conserved tetrads (beige), hotspot residues on the top face (grey), population variation (green) and all amino acid residues in the domain (blue) in the TBLR1 protein. P-values are not significant between the diagnostic/tetrad/top face residues or between population/all residues, but are significant between these groups (diagnostic versus population residues, P = 9×10⁻⁵).

