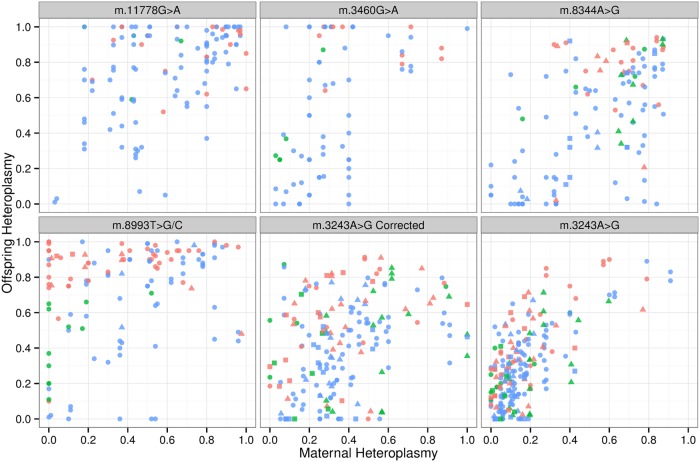
Figure 3.
Relationship between the level of mtDNA heteroplasmy in mothers and offspring for five pathogenic mtDNA mutations. Maternal and offspring heteroplasmy levels are displayed as a proportion. Red symbols= affected proband, green symbols= mother of the proband, blue= other relatives. Circles= meta-analysis data, triangles= new pedigree data measured at Centre 1, squares= new pedigree data measured at Centre 2. m.3243A>G corrected refers to heteroplasmy values after a correction for the known decline in heteroplasmy levels with age (14).

