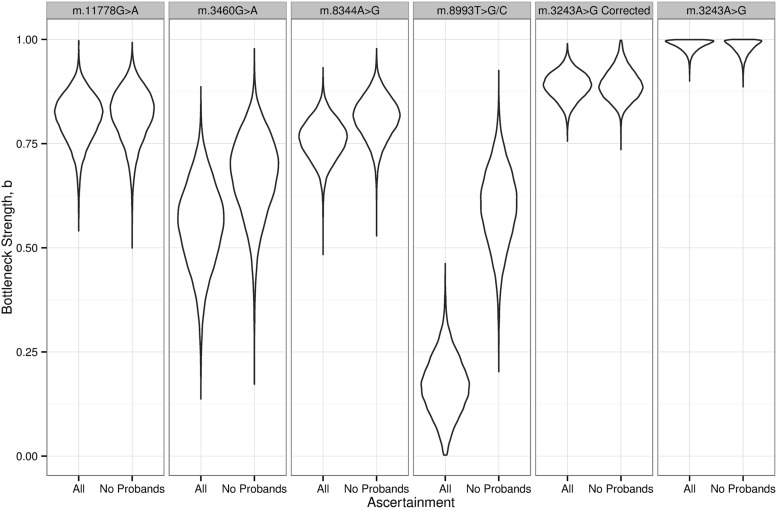
Figure 4.
Differences in the size of the mitochondrial DNA genetic bottleneck of five pathogenic mtDNA mutations. Violin plots show the probability density for a given bottleneck strength parameter, b, calculated from actual heteroplasmy measurements in human pedigrees shown in Figure 3. All= all of the mother–child pairs. No probands= mother–child pairs remaining after the exclusion of an affected proband, thus minimising ascertainment bias. ‘m.3243A>G corrected’ refers to heteroplasmy values after a correction for the known decline in heteroplasmy levels with age (14).

