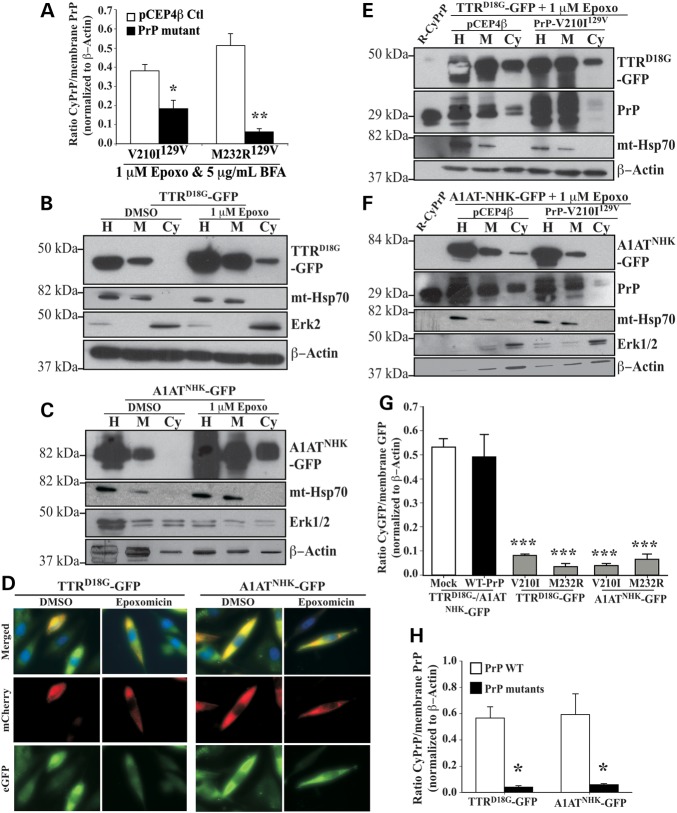
Figure 2.
Familial PrP mutants inhibit retrotranslocation of both endogenous cellular PrP and other ERAD substrates. (A) Quantification by densitometry of western blot analyses of CyPrP levels relative to membrane PrP levels in CR7 cells transfected with pCEP4β-empty, pCEP4β-PrP-V210I129V or -PrP-M232R129V and subjected to the subcellular fractionation. Data are depicted as a ratio of CyPrP relative to membrane PrP after normalizing to actin levels. *P < 0.05, **P < 0.01 (B, C) Western blot analysis with anti-GFP, anti-mt-Hsp70, anti-Erk1/2 and anti-β Actin in CR7 cells transfected with pcDNA3.1(-)-TTRD18G-GFP or pcDNA3.1(-)-A1ATNHK-GFP and subjected to subcellular fractionation. Proteins were loaded as in Figure 1A. (D) Fluorescence microscopy of CR7 cells co-transfected with mCherry-ER and TTRD18G-GFP or A1ATNHK-GFP treated with DMSO or epoxomicin. Nuclear DNA is identified using Hoechst staining. (E,F) Western blot analysis with anti-GFP, anti-PrP, anti-mt-Hsp70, anti-Erk1/2 and anti-β-actin in CR7 cells co-transfected with TTRD18G-GFP (E) or A1ATNHK-GFP (F) and PrP-V210I129V, followed by the subcellular fractionation assay. (G) Densitometry quantification of western blot analysis for cytosolic GFP in CR7 cells co-transfected with either TTRD18G-GFP or A1ATNHK-GFP and with PrP-V210I129V or PrP-M232R129V. Data are depicted as a ratio of cytosolic GFP relative to membrane GFP, represent the mean ± SEM of at least three independent experiments and are analyzed using a one-way ANOVA followed by Tukey's post-tests. *P < 0.05, ***P < 0.001. (H) Densitometry quantification of western blots for wild-type or mutant CyPrP relative to membrane PrP in cells transfected with TTRD18G-GFP or A1ATNHK-GFP. Statistical evaluations were done as in G.

