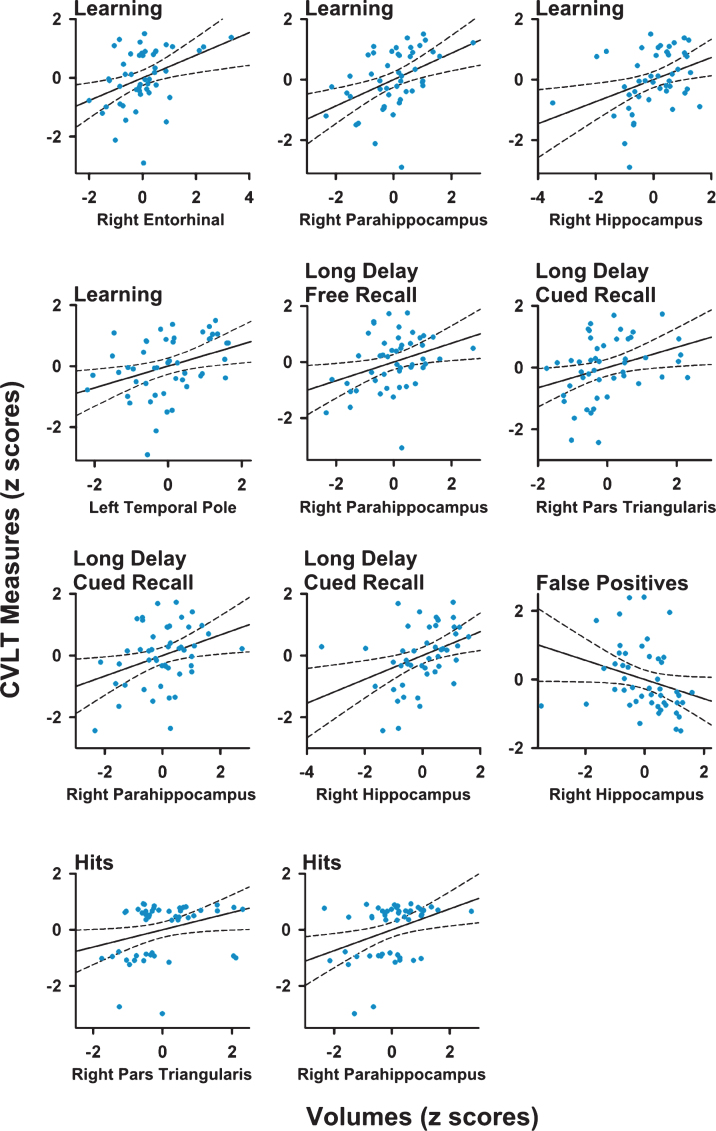
Fig.2.
Scatter plots showing significant correlations between measures of memory and regional volumes in Parkinson’s patients. For most variables, age and gender adjusted residuals for MRI volumes and CVLT measures are plotted. An exception is CVLT learning, for which levodopa dosage equivalence, age, and gender adjusted residuals are plotted. Solid and dotted lines display the best-fitting linear regression line and 95% confidence intervals.

