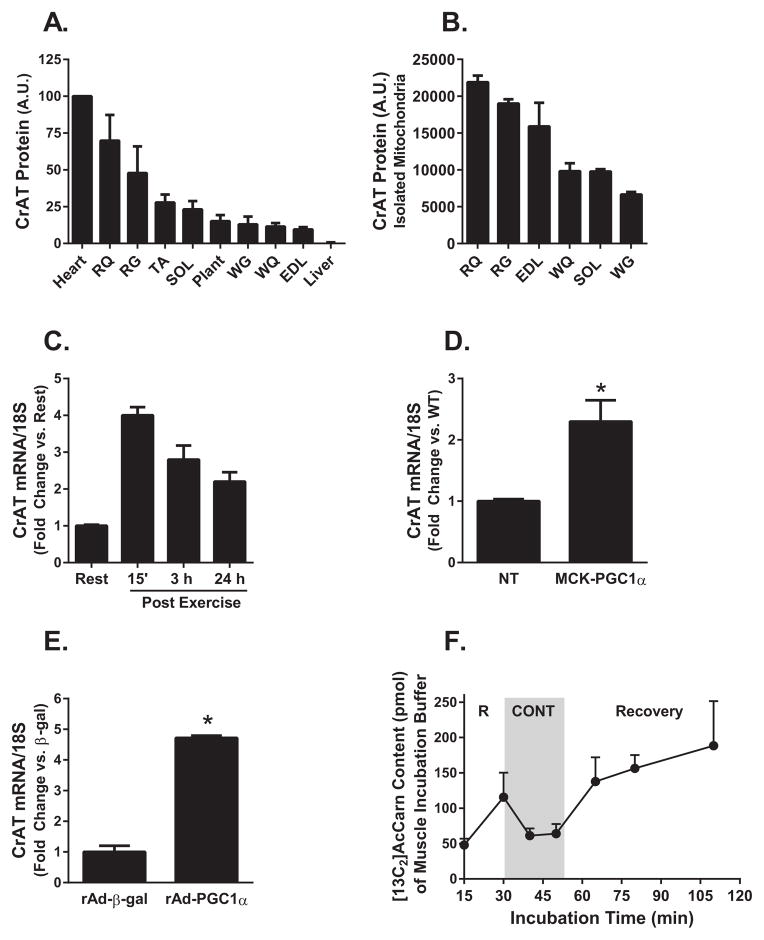
Figure 1. CrAT fiber type distribution and regulation by exercise.
(A) CrAT protein abundance was determined in three-month-old rat heart, red quadriceps (RQ), red gastrocnemius (RG), tibialis anterior (TA), soleus (SOL), plantaris (Plant), white gastrocnemius (WG), white quadriceps (WQ), extensor digitorum longus (EDL) and liver tissue homogenates and (B) isolated mitochondria. Values are expressed as arbitrary units (A.U.). CrAT mRNA expression normalized to 18S was determined in (C) mouse tibialis anterior muscle at rest and 15 min, 3 h and 24 h after a 90 min exercise bout, (D) tibialis anterior muscle from MCK-Pgc1α transgenic and non-transgenic (NT) control mice, and (E) primary human skeletal myocytes treated with recombinant adenovirus encoding β-galactosidase or rat Pgc1α. (F) [13C2]Acetylcarnitine content (pmol/muscle) of the incubation buffer was measured after isolated mouse soleus muscles were incubated in KHB buffer supplemented with 5 mM [U-13C] glucose and 2 mM [U-13C pyruvate] for 30 min of rest (R), followed by electrically-stimulated contraction (CONT) and recovery. Data are means ± SEM (n=3–5). * p<0.05.

