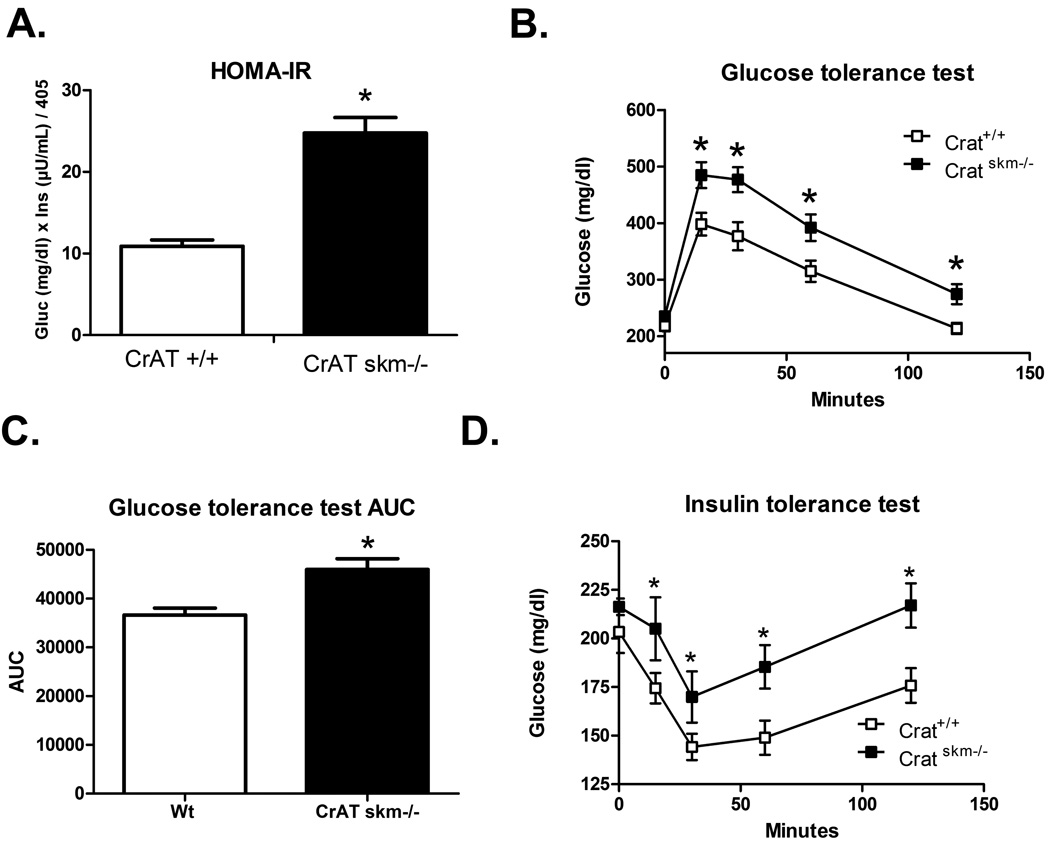
Figure 6. Hyper-acetylation of mitochondrial proteins in CrATskm−/− mice is accompanied by glucose intolerance.
CrATfl/fl and CrATskm−/− mice were fed a high fat diet for 8 weeks prior to assessment of glucose control obtain in the morning after a 2 hour fast. (a) HOMA insulin resistance (IR) index (n = 5–8 per group, *p<0.05 versus CrAT fl/fl by Student’s t-test). (b) Glucose tolerance test performed using i.p. injection of 2g glucose per Kg bodyweight (n = 5–8 per group, *p<0.001 by Student’s t-test). (c) Area under the curve from the tests shown in panel b (*p<0.005 by Student’s t-test). (d) Insulin tolerance test performed using i.p. injection of 0.75U humulin per Kg bodyweight (n = 5–8 per group, *p<0.001 by Student’s t-test).

