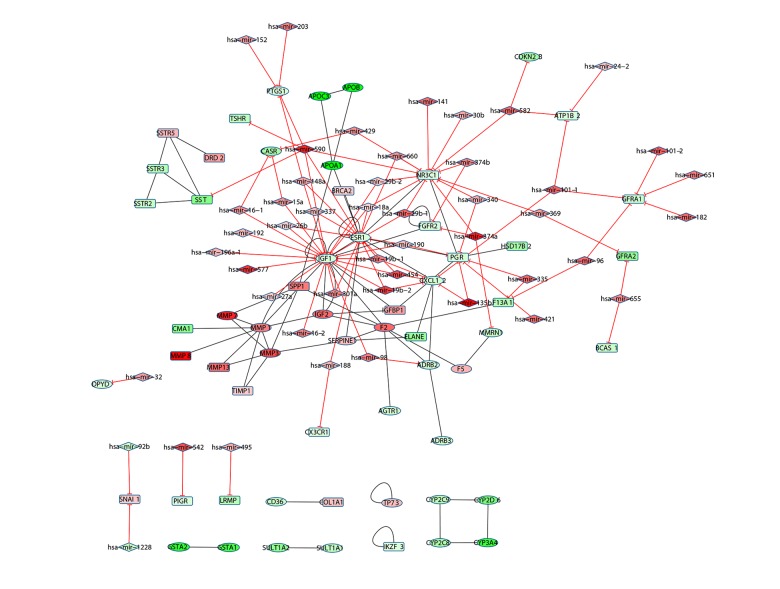
Figure 4.
miRNA-Gene interaction network of colon adenocarcinoma. The diamond nodes represent colon adenocarcinoma-related miRNAs and the rounded rectangle nodes represents other cancer-related miRNAs. The side with the red T-shaped arrow indicates the regulation relationship between miRNA and gene, and the black edge indicates the interaction between gene products. The colors of nodes indicate the fold change of miRNA or gene expression; green means down-regulated and red means up-regulated.

