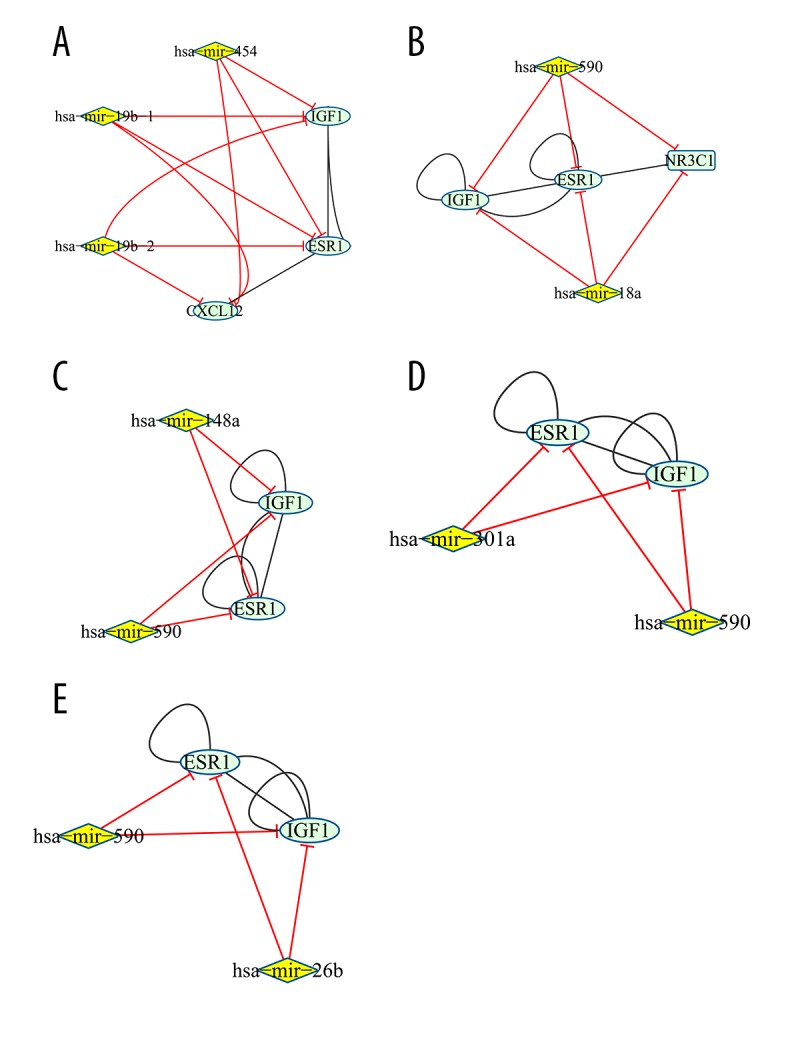
Figure 5.

The clusters of target genes jointly regulated by miRNA in miRNA-Gene network. Yellow node and blue green node represent miRNA and target gene, respectively. The red edge represents the relationship between miRNA and gene, while the black edge represents the interaction relationships of gene products.
