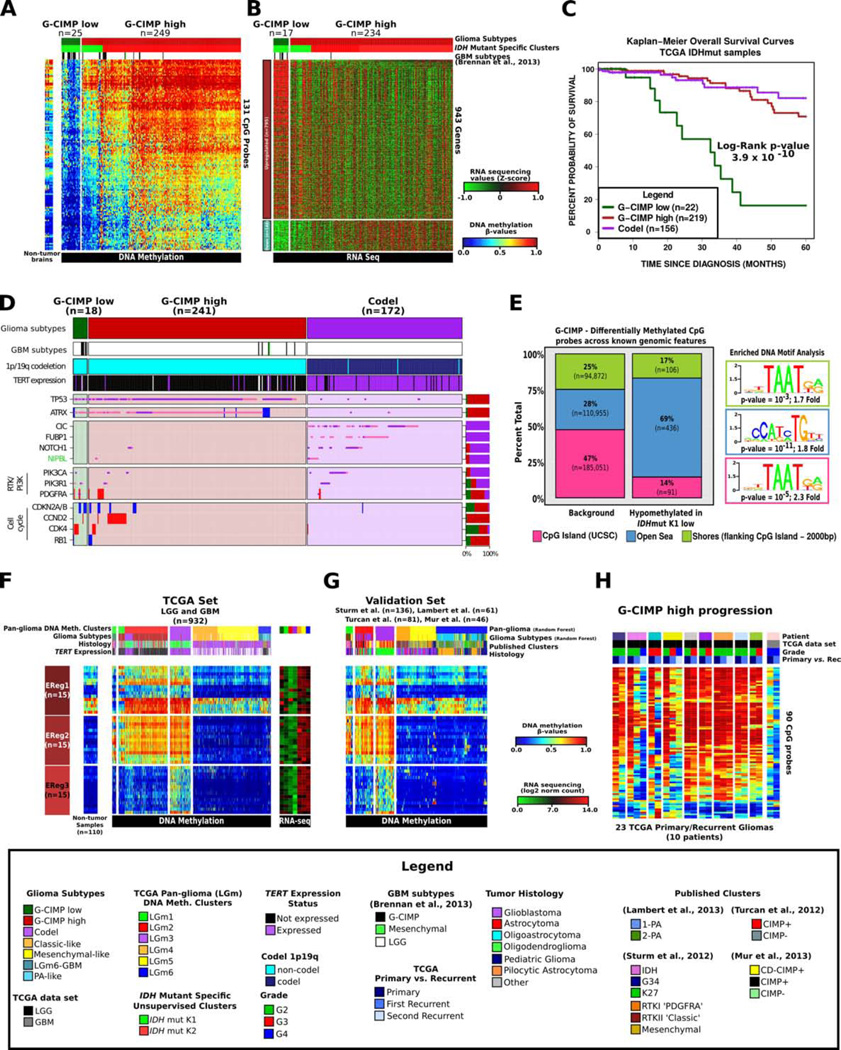
Figure 3. Identification of a distinct G-CIMP subtype defined by epigenomics.
A. Heatmap of probes differentially methylated between the two IDH-mutant-non-codel DNA methylation clusters allowed the identification of a low-methylation subgroup named G-CIMP-low. Non-tumor brain samples (n=12) are represented on the left of the heatmap. B. Heatmap of genes differentially expressed between the two IDH-mutant-non-codel DNA methylation clusters. C. Kaplan-Meier survival curves of IDH-mutant methylation subtypes. Ticks represent censored values. D. Distribution of genomic alterations in genes frequently altered in IDH-mutant glioma. E. Genomic distribution of 633 CpG probes differentially demethylated between co-clustered G-CIMP-low and G-CIMP-high. CpG probes are grouped by UCSC genome browser defined CpG Islands, shores flanking CpG island +/− 2kb and open seas (regions not in CpG islands or shores). F. DNA methylation heatmap of TCGA glioma samples ordered per Figure 2A, and the epigenetically regulated (EReg) gene signatures defined for G-CIMP-low, G-CIMP-high and Codel subtypes. NThe mean RNA sequencing counts for each gene matched to the promoter of the identified cgID across each cluster are plotted to the right. G. Heatmap of the validation set classified using the random forest method1,300 probes defined in Figure 2A. H. Heatmap of probes differentially methylated between G-CIMP-low and G-CIMP-high in longitudinally matched tumor samples.

