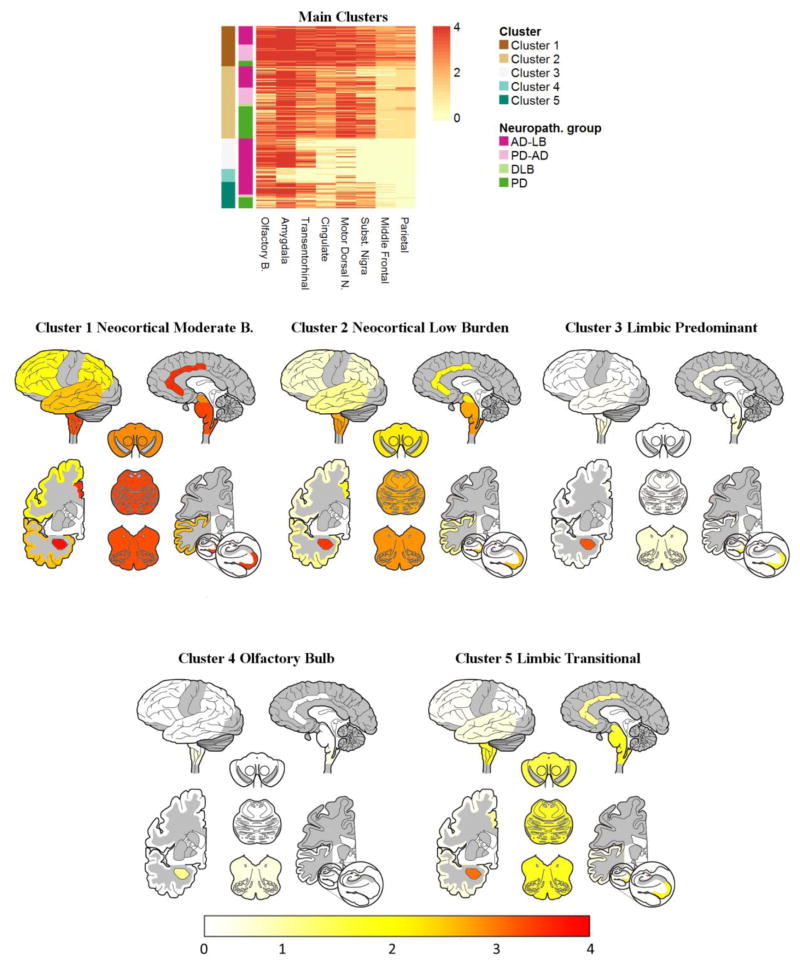
Figure 2. BBDP clusters heatmaps (top) and brain maps showing LRP pathology distribution in the clusters (bottom).
First colored column on the left of the heatmaps represents cluster identify and second column represents clinico-pathological diagnosis with LRP-only groups in green colors (PD and DLB) and groups with coincident LRP and AD in magenta colors (AD-LB and PD-AD). Color scale of the brain maps below represents the mean semi-quantitative scores in each cluster.

