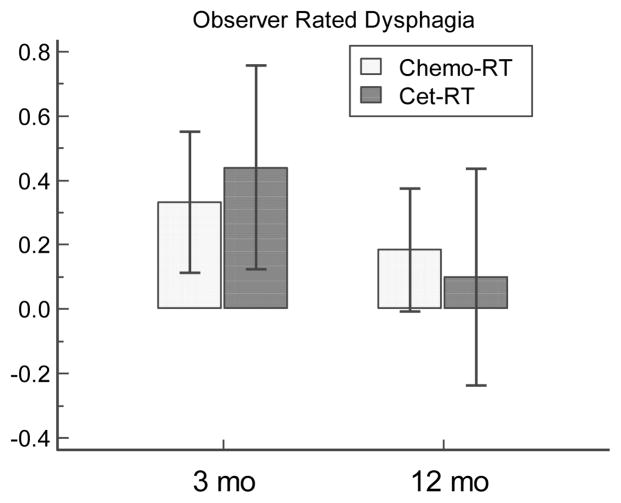
Figure 2.
CTCAE observer-rated dysphagia comparison between chemo-RT and cet-RT at 3 and 12 months. Histogram representation of results. Bars are mean score changes from baseline, and whiskers are 95% CI. Higher scores denote worse observer rated dysphagia. See supplementary Table 2 for statistical analysis.

