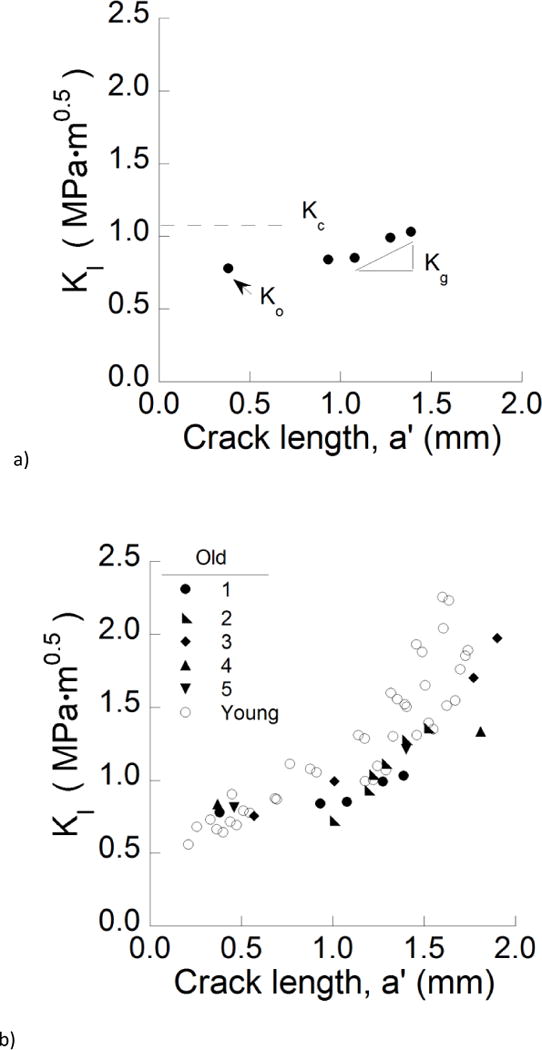
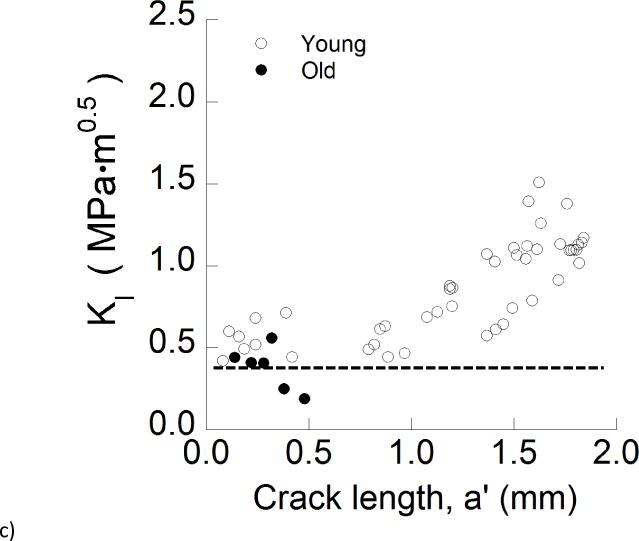
Figure 4.


Crack growth resistance of the enamel. a) Representative crack growth resistance curve (R-curve) for the longitudinal direction in an old specimen. The quantities Ko, Kg, Kc represent the initiation, growth and fracture toughness, respectively. b) A comparison of the crack growth resistance in the longitudinal direction for young and old specimens. c) A comparison of the crack growth resistance in the transverse direction for young and old specimens. The dashed line demarcates the mean fracture toughness of the old specimens.
