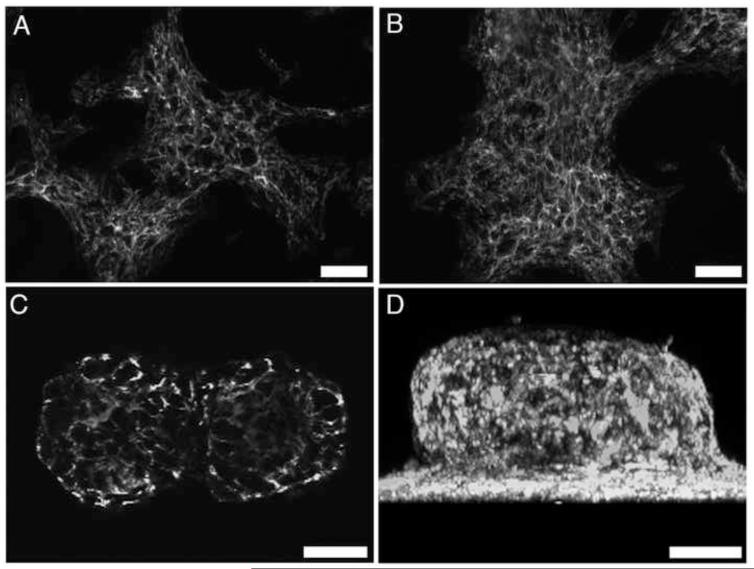
Fig. 7.
Fibronectin fibril formation within 3D aggregates. FN-null MEFs were seeded (2 × 10⁴ cells/cm2) onto plates pre-coated with 400 nM FNIII1HRGD, allowed to adhere for 4 h, and then treated with 25 nM fibronectin. Cells were processed for immunofluorescence microscopy at 24 (A), 48 (B), or 72 (C,D) h post-seeding and immunostained for fibronectin. Images were collected along the z-axis at 1μm intervals using two-photon microscopy. Image in (C) is a representative slice taken 40 μm above the surface of the culture plate. (D) Z-slice images were reconstructed in 3D and projected along the x-y plane. Images represent 1 of 3 experiments performed. Scale bars, 50 μm.

