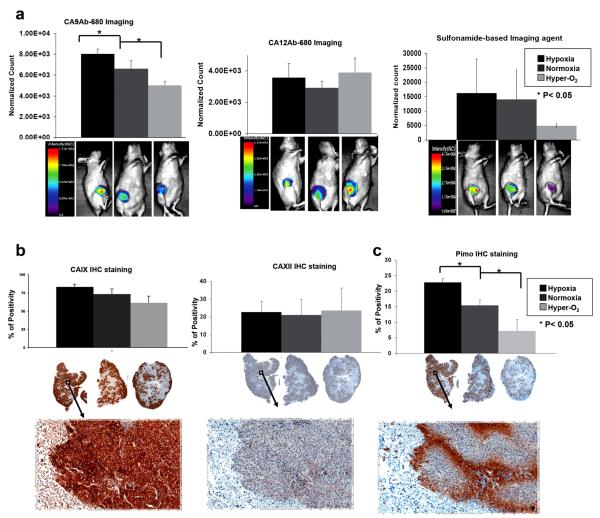
Fig. 4.
In vivo expression of CAIX and CAXII in hypoxic, normoxic and hyperoxic conditions. a Quantification of CA9Ab-680, CA12Ab-680 and HypoxiSense680 (a sulfonamide-based probe from Perkin-Elmer)-related fluorescence in ZR-75.1 tumors of animals treated with 7 % oxygen (hypoxia, black), no treatment (normoxia, dark gray), or nicotinamide and carbogen (hyper-O2, light gray). Representative images are shown from each group of animals below each graph. Note that the scales are different and the images were acquired 5 h after agent administration. b Quantification of CAIX and CAXII IHC staining of ZR-75.1 tumors from the same animals presented in panel Images of representative IHC staining are underneath each graph. c Quantification of pimonidazole staining (hypoxia marker) for the same set of animals presented above with representative of low and high magnification images of staining underneath each graph. Data represent the mean±SD of at least four independent animals. Asterisk indicates significant difference (*p<0.05) compared to no treatment.

