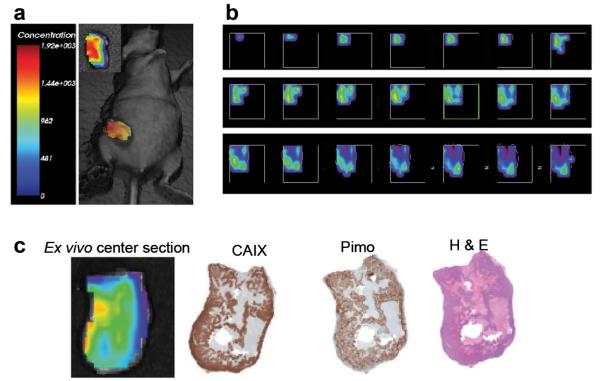
Fig. 6.
Fluorescence tomographic imaging of ZR-75.1 xenograft tumor. a 3D reconstruction of CA9Ab-680 fluorescence in a ZR-75.1 tumors 5 h post administration of probe. Inset shows ex vivo image of the whole tumor. b Top to bottom slices of the same tumor. Slices are 1 mm thick each, ranging from the upper left (top of tumor) to the lower right (bottom of tumor). c From left to right, ex vivo fluorescence image of a 1 mm center section of the tumor and corresponding CAIX IHC staining, pimonidazole staining and H&E staining of adjacent sections taken from the 1-mm center section. The 1-mm center section was cut in the coronal orientation in order to register with the tomographic image as best possible.

