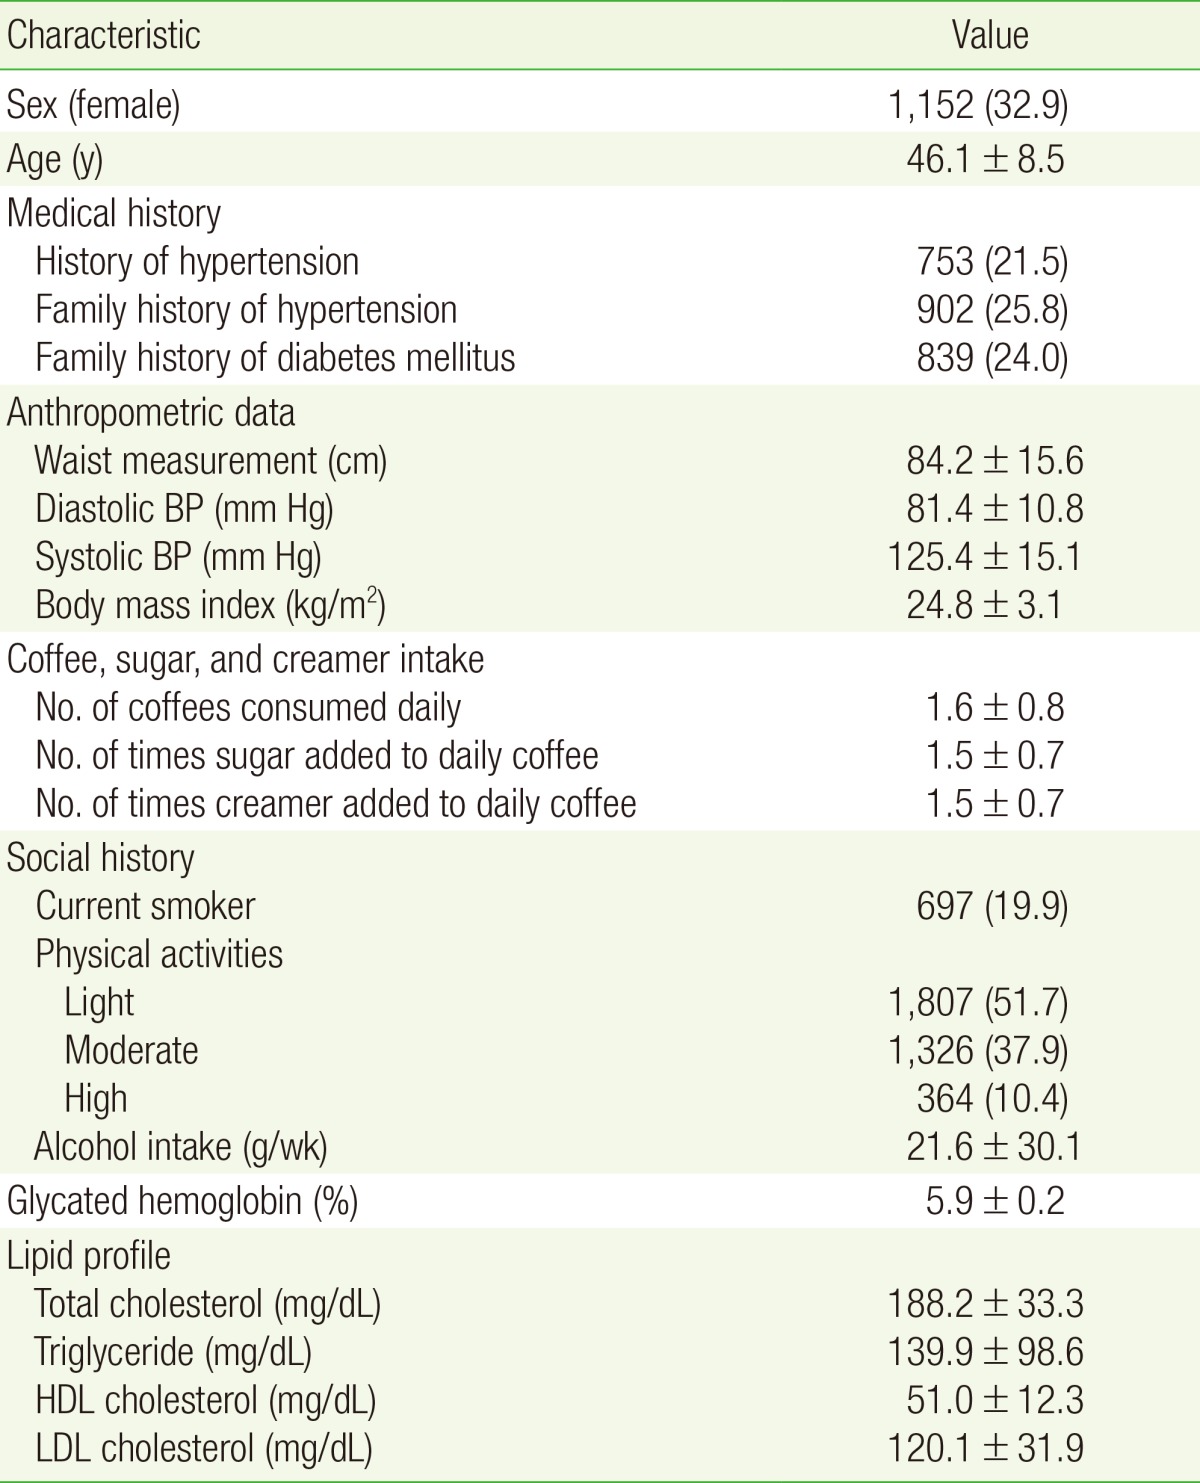
Table 2. General study population characteristics at baseline (n = 3,497).

Values are presented as number (%) or mean±standard deviation.
BP, blood pressure; DM, diabetes mellitus.

Values are presented as number (%) or mean±standard deviation.
BP, blood pressure; DM, diabetes mellitus.