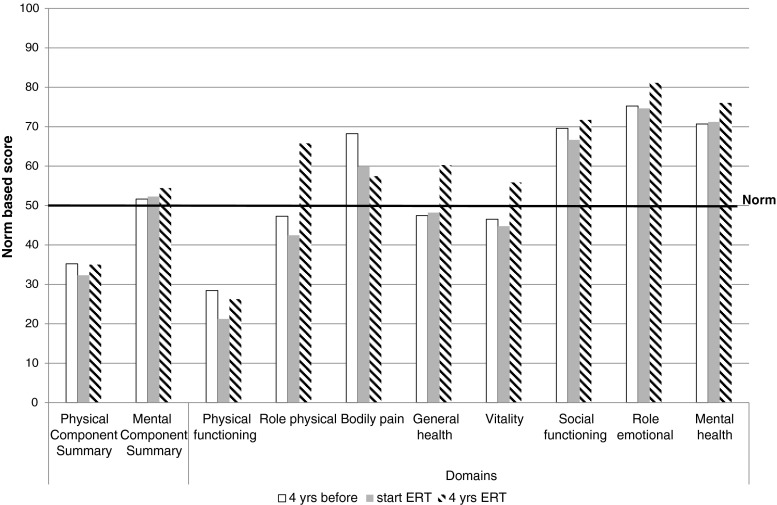
Fig. 2.
Expected SF-36 quality of life scores before, at start and during ERT. The figure displays the expected mean scores 4 years before starting ERT, at start of ERT and after 4 years of ERT as calculated using the results from the statistical model presented in Table 2

