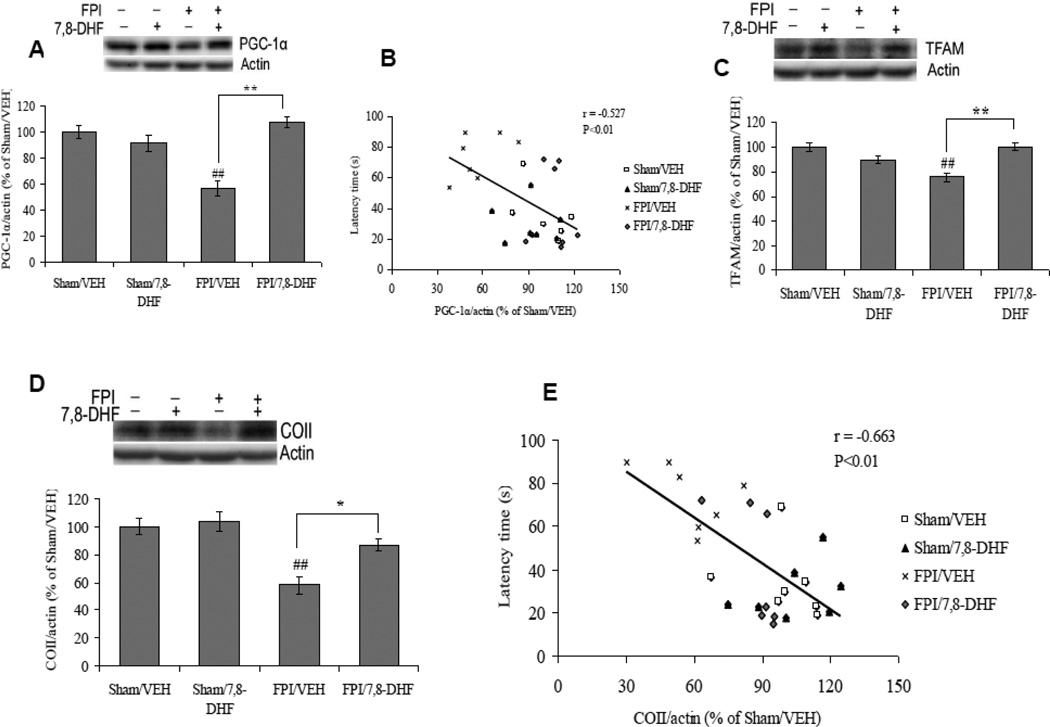
Fig. 6.
(A) Protein levels of PGC-1α, (B) correlation analysis of PGC-1α with latency time in Barnes maze test, (c) TFAM levels, (D) COII levels and (E) correlation analysis of COII with latency time in Barnes maze test in vehicle (VEH) and 7,8-dihydroxyflavone (7,8-DHF; 5 mg/kg, ip) treated rats, subjected to either sham or fluid percussion injury (FPI). Data are expressed as percentage of Sham/VEH (mean ± SEM). ##P<0.01 vs. Sham/VEH; *P<0.05, **P<0.01 vs. FPI/VEH; ANOVA (two-way) with Bonferroni's comparisons post-hoc test.

