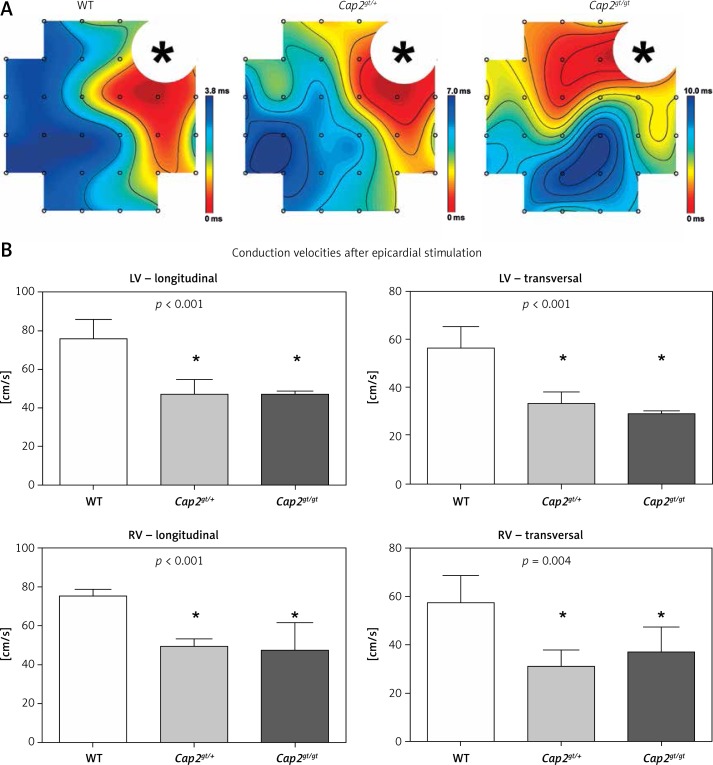
Figure 3.
Epicardial mapping. A – Representative epicardial activation maps after applied pacing from the left ventricle. Isochrones are illustrated by black lines, the distance between each line representing 1 ms delay. Accumulation of isochrones as shown in Cap2gt/+ and Cap2gt/gt indicates local slowing of conduction. The area of stimulus application is marked with an asterisk. B – Both mutant groups revealed a significant slowing of conduction in longitudinal and transversal myocardial fiber orientation in the left (LV) and right ventricle (RV)
*p < 0.05 compared to WT. WT: n = 4, Cap2gt/+: n = 4, and Cap2gt/gt: n = 3.

