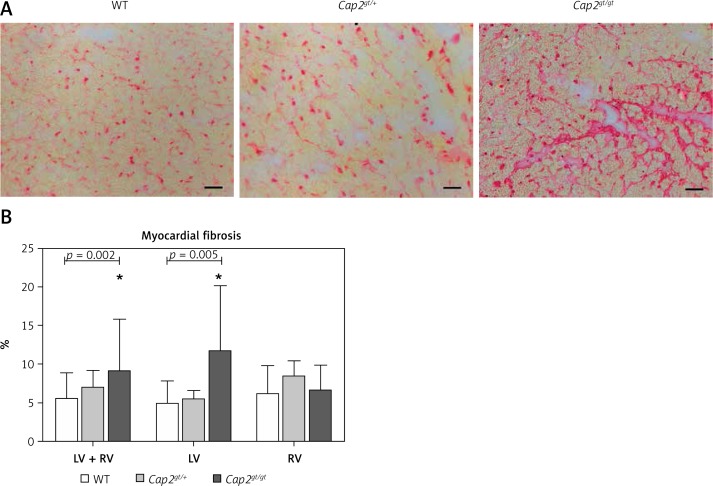
Figure 6.
Myocardial fibrosis. A – Sirius red staining of left ventricular heart sections. An increase in red stained intercellular connective tissue could be detected in Cap2gt/gt. Bar = 20 μm. B – Pixel analysis revealed a significant increase in ventricular fibrosis only in Cap2gt/gt
LV – left ventricle, RV – right ventricle, *p < 0.05 compared to WT; WT: n = 8, Cap2gt/+: n = 4, and Cap2gt/gt: n = 4.

