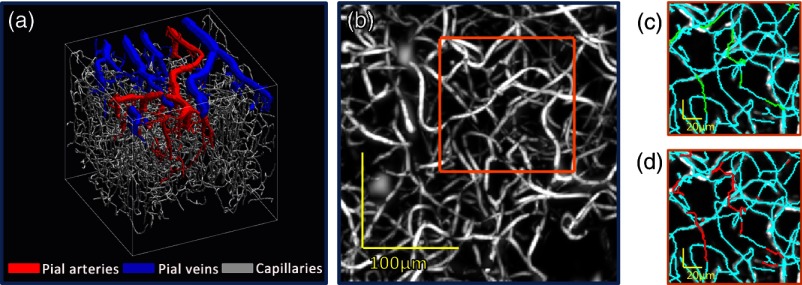
Fig. 3.
Correction of cortical vascular graphs acquired using the high NA imaging geometry and dynamic focusing. (a) 3-D representation of the segmented cortical vasculature showing pial vessels (arteries in red, veins in blue) and capillaries (gray). (b) MIP of capillary bed vessels from the enhanced OCM image data set. MIPs of image data from this data set were previously published by Srinivasan et al.12 (c) MIP of image intensity from the highlighted section in panel b, overlaid with the original uncorrected skeleton (cyan) and branches drawn during manual correction (green). (d) MIP of image intensity, overlaid with the original uncorrected skeleton (cyan) and branches drawn during automated correction (red).

