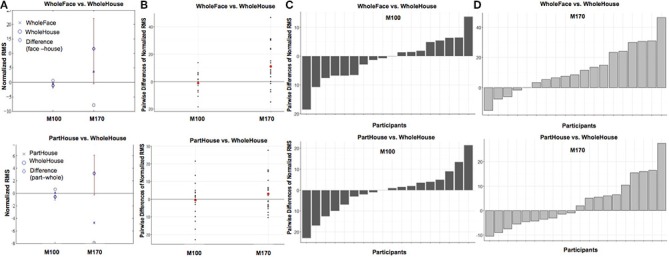
Figure 4.

Comparisons of target (face vs. house) when preceded by a whole prime (A) and of prime wholeness (part vs. whole) when followed by a Mooney House (B). For each condition comparison, Column (A) shows mean difference between the conditions, plotted with a diamond, and the confidence interval (percentile bootstrap, 1000 sample trials, p < 0.05) around the mean difference marked with a red line. The mean difference is significant when the confidence interval does not contain zero. Column (B) shows the scatterplot of the pairwise differences for each condition comparison. Each black dot represents an individual participant. The mean response difference is represented by a red dot. The pairwise difference for each participant in each condition comparison is shown for the M100 response in Column (C) and the M170 response in Column (D).
