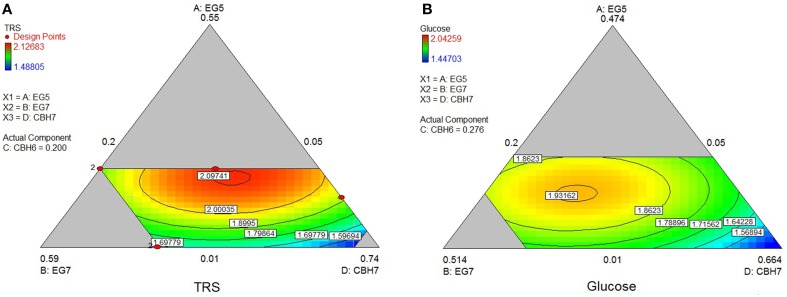
Figure 5.
Ternary plots showing predicted final total reducing sugars TRS (A) and Glc (B) yields from spruce hydrolysis, as a function of three out of four “core” enzymes (MtCBH7, MtEG5, MtEG7) content. For each plot, the forth enzyme (MtCBH6) has been fixed to the proportion of the point resulting in the optimal TRS yield, as predicted by the model. Ternary plots with other enzyme combinations are shown at Supplementary Material.

