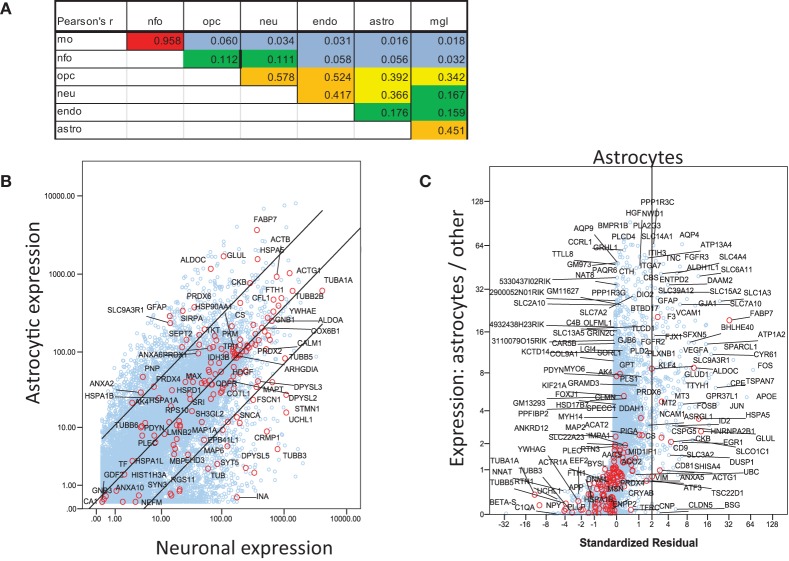
Figure 1.
Analysis of mouse RNAseq data from http://jiaqianwulab.org/resource.htm (Zhang et al., 2014; Dong et al., 2015). (A) Correlation coefficients between cell types for all genes. (B) Linear regression of gene expression in ASTRO and NEU. Genes for proteins included in Table 1 are represented by red circles and labeled where space permits. Other genes are represented by blue circles. Center line represents best fit and outer lines 95% confidence limits after log transformation of data. (C) Multiple regression of ASTRO against other cell types. Linear regression of untransformed expression data for ASTRO against data for MO, OPC, NEU, and ENDO, was performed, and standardized residuals were computed. NFO were omitted from all multiple correlations because of their very high correlation with MO. Standardized residuals are potted on X-axis. The Y axis represents the ratio between expression level in ASTRO and the average expression levels in the other five cell types. Genes with standardized residual values above two (i.e., to the right of the vertical line) were considered enriched in astrocytes. Colors are as in (B); both red and blue circles are labeled where space permits.

