Figure 4.
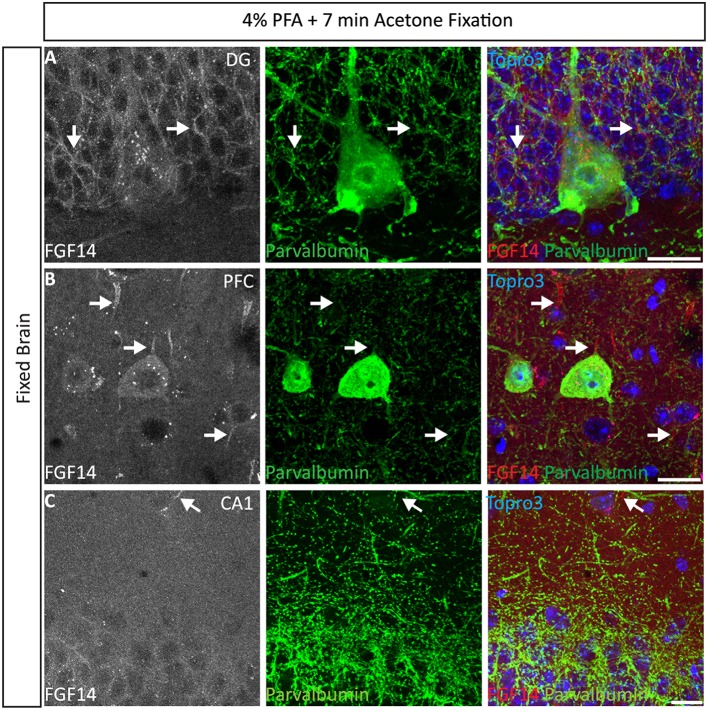
Representative examples of double immunofluorescence staining of mouse brain tissue using 4% PFA perfusion and acetone-based post-fixation treatment. For the entire figure, the gray and red channels represent FGF14 immunoreactivity visualized with an Alexa 568-conjugated secondary antibody; the green channel represents parvalbumin immunoreactivity visualized with an Alexa 488-conjugated secondary antibody; image overlaid of the green, red, and blue channel (representing Topro-3 nuclear staining) in the DG region (A), PFC region (B), and CA1 region (C). (C) The same staining and immunolabelling used in (A,B) reveals a rather weak signal corresponding to FGF14 immunoreactivity, but selective parvalbumin labeling of somata and dendrites (green) in the CA1 hippocampal region. Arrows show FGF14 signals at the axon initial segment (AIS). DG, dentate gyrus; PFC, pre-frontal cortex; PFA, paraformaldehyde. Scale bars represent 20 μm.

