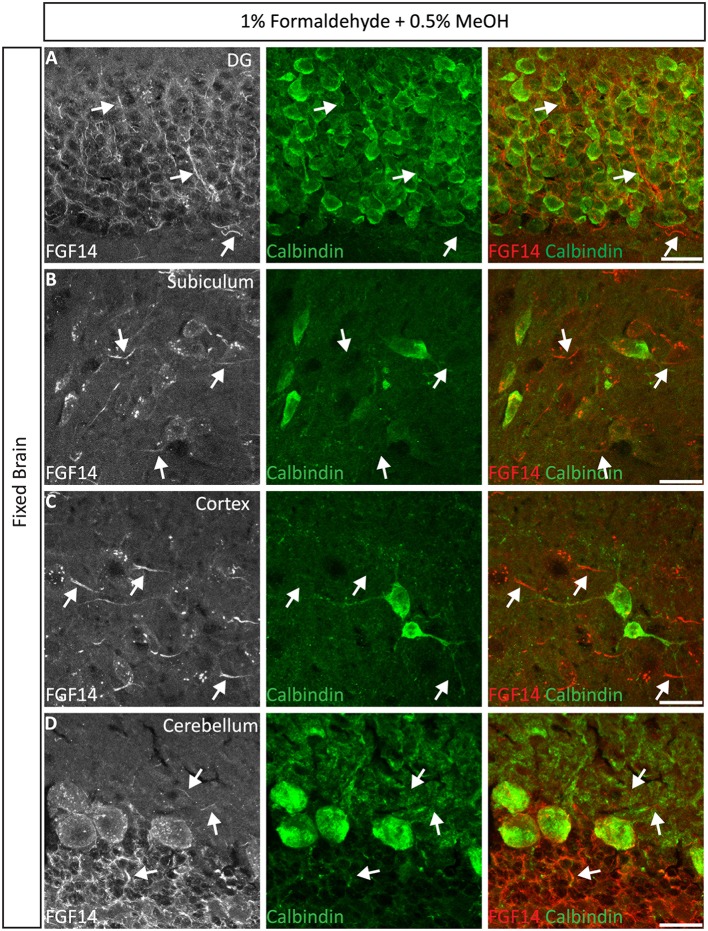
Figure 5.
Representative examples of double immunofluorescence staining of mouse brain tissue using 1% formaldehyde and 0.5% MeOH fixation. (A–D) For the entire figure, the gray and red channels represent FGF14 immunoreactivity and the green calbindin in indicated brain regions. The corresponding green and red merged images are shown in the right column. Arrows indicate FGF14 signal at the axon initial segment (AIS). DG, dentate gyrus. Scale bars represent 20 μm.

