
FIGURE 2.
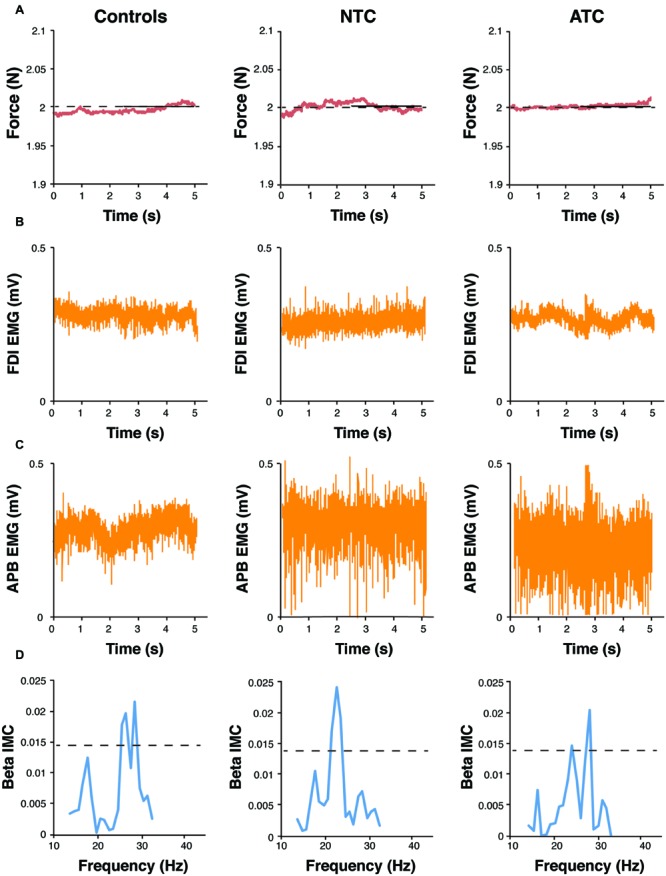
(A) Trace of task-related force variability in a 2-Newton force, 40 s static hold task, is displayed in a sample control, novice TC, and advanced TC subject. Surface electromyography (EMG) recorded from the (B) first dorsal interosseous (FDI) and the (C) abductor pollicis brevis (AbPB) muscles of the right hand in a sample control, novice TC, and advanced TC subject. (D) Examples of peak beta (15–30 Hz) intermuscular coherences (IMC) in a sample control, novice TC, and advanced TC subject.