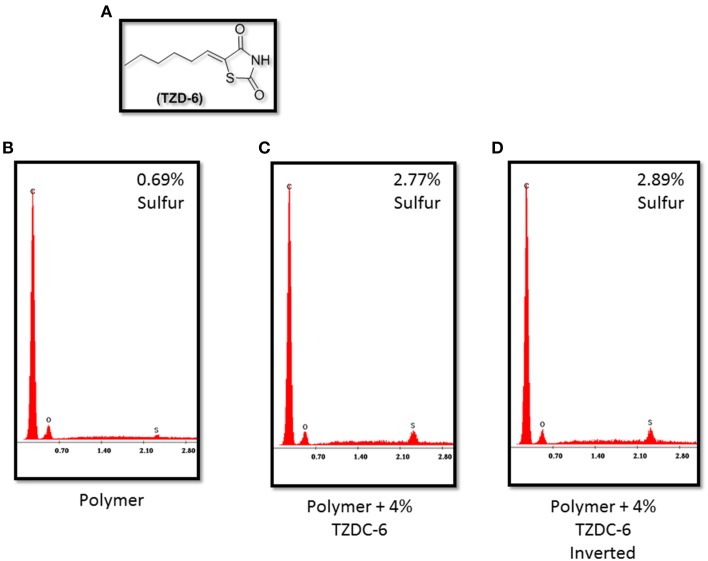
Figure 3.
(A) Thiazolidinedione derivative TZDC-6. Energy Dispersive X-ray Spectrometry graphs indicating relative sulfur concentrations in TZDC-6 infused polymers. Naked polymer (B) shows <0.69% sulfur composition, while both samples coated with TZDC-6 infused polymers (C,D) show similar TZDC-6 concentrations on surface, irregardless of drying angle. Percentage values represent a mean of four different isolated points tested. C, Carbon; O, Oxygen; S, Sulfur.

