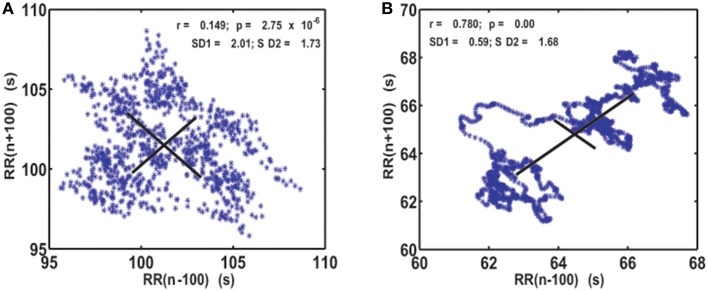
Figure 1.
Visualization of the system dynamics with generalized Poincaré plot for j = k = 100 RR intervals, in patient with atrial fibrillation (A) and healthy subject (B). SD1 and SD2, drawn with solid lines, are measures of dispersion of 100 successive summed RR intervals along and away from the identity line.

