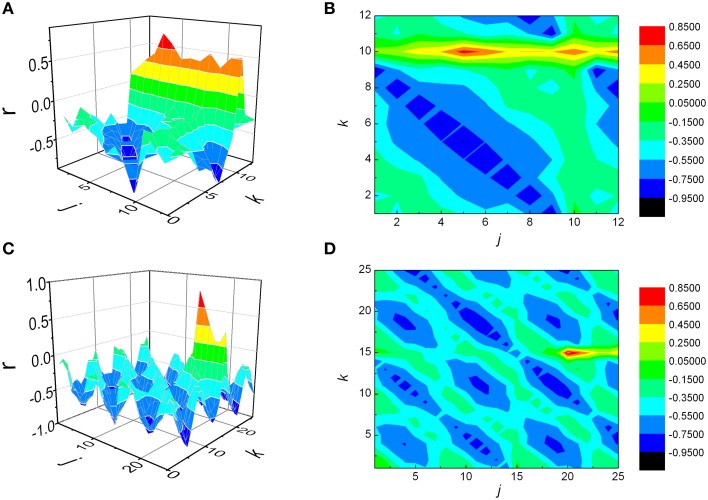
Figure 8.
Matrices of Pearson's correlation coefficients (r) between j preceding and k following RR intervals, obtained for two synthetic signals. The first signal was generated in such a way that maximal correlation is to be achieved when summed j = 5, k = 10 intervals are being observed (case where j < k, A and B), while in case of the second one the values were j = 20, k = 15 (j > k, C and D). As presented, in both cases the analysis was able to detect correctly positions of rmax.

