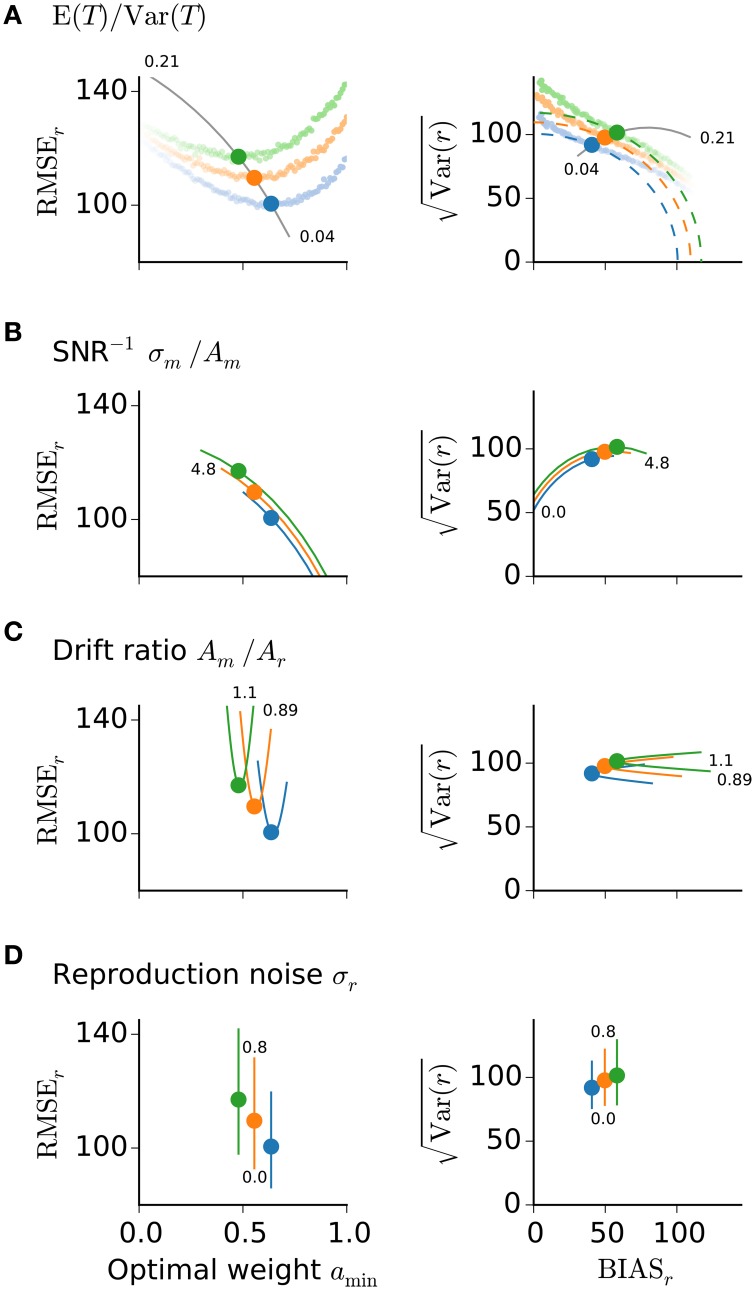
Figure 3.
Reproduction error and model parameters. Root-mean-squared error (left panels) and its representation on a quarter circle vs. BIASr (right panels) are displayed for the optimal memory weight amin conditioned on E (T)∕Var (T) (A), the inverse SNR of measurement σm∕Am (B), the drift ratio Am∕Ar (C), and the noise level σr during reproduction (D). Solid lines show the predictions of amin for different values of the respective ratio or parameter. Small numbers mark the range of values. Large dots mark the theoretical predictions from Equation (19) and correspond to the memory weights a taken in Figure 1. Colors as in Figure 1. In (A) also simulation results are displayed for the three stimulus ranges from Figure 1 and different values of a (small dots, fainter colors correspond to smaller values of a). The simulations confirm the theoretical predictions for the optimal values amin.

